Accessing Your Instagram Insights Dashboard
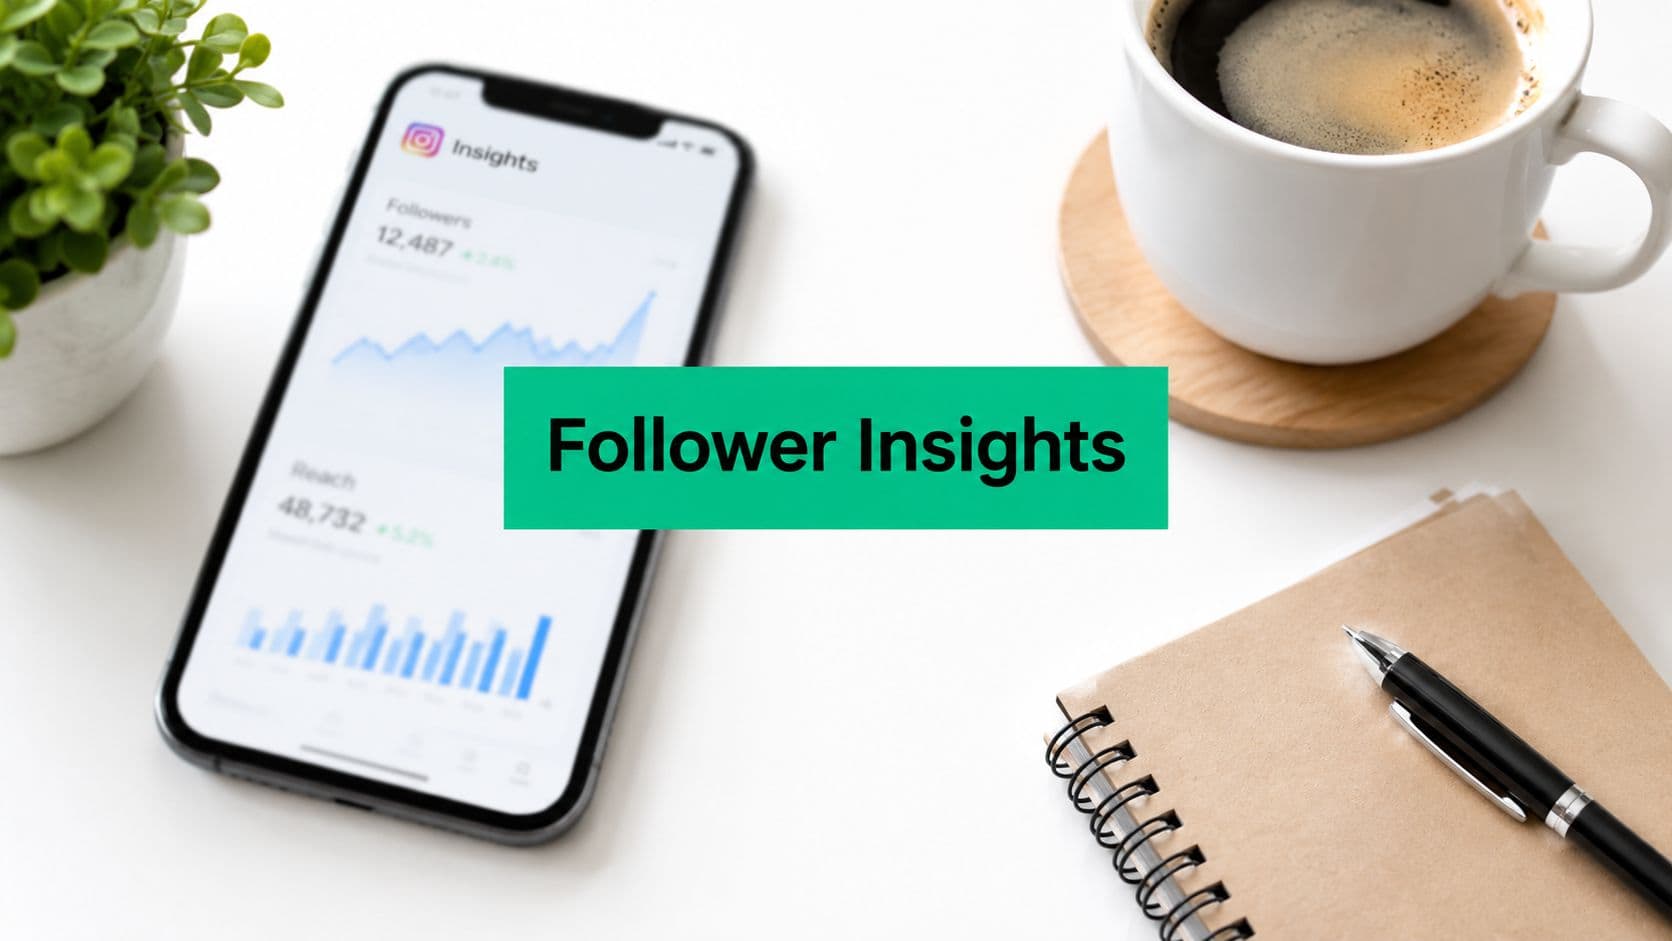
Want follower analytics on Instagram? Start by getting into Instagram Insights, because the public profile view only shows a follower count, not the audience detail you need for real analysis. Native insights are available on Business and Creator accounts, and that is the first gate to clear. For a broader walkthrough of the dashboard, the Instagram Insights overview is a helpful reference. For background on Instagram's analytics features, the platform's account structure explains why access differs by profile type.
Switch the account type first
Open your Instagram profile in the mobile app, then use the menu to find the professional account settings. Switch to a Professional account, then choose Business or Creator based on how you use the account. That change opens the dashboard where follower and content data become visible.
Practical rule: check account type before anything else, because personal profiles do not show the native Insights view.
Find the follower data in the app
After the switch, return to your profile and open the professional dashboard or Insights area. From there, look for the audience or follower section to review follower information, content metrics, and profile activity. Instagram's analytics can also show reporting periods such as 7 days, 30 days, 3 months, 6 months, 1 year, and 2 years, although labels and availability can vary by account and app version.
The interface changes over time, but the workflow stays steady. Go to the profile, open the dashboard, then move into the audience view if you want follower-specific detail instead of broader account performance. That distinction matters, because follower counts and reached audiences are not the same thing. Public visibility shows who follows you. Insights show whether those followers are seeing and responding to what you post.
Key Metrics to Understand in Instagram Analytics
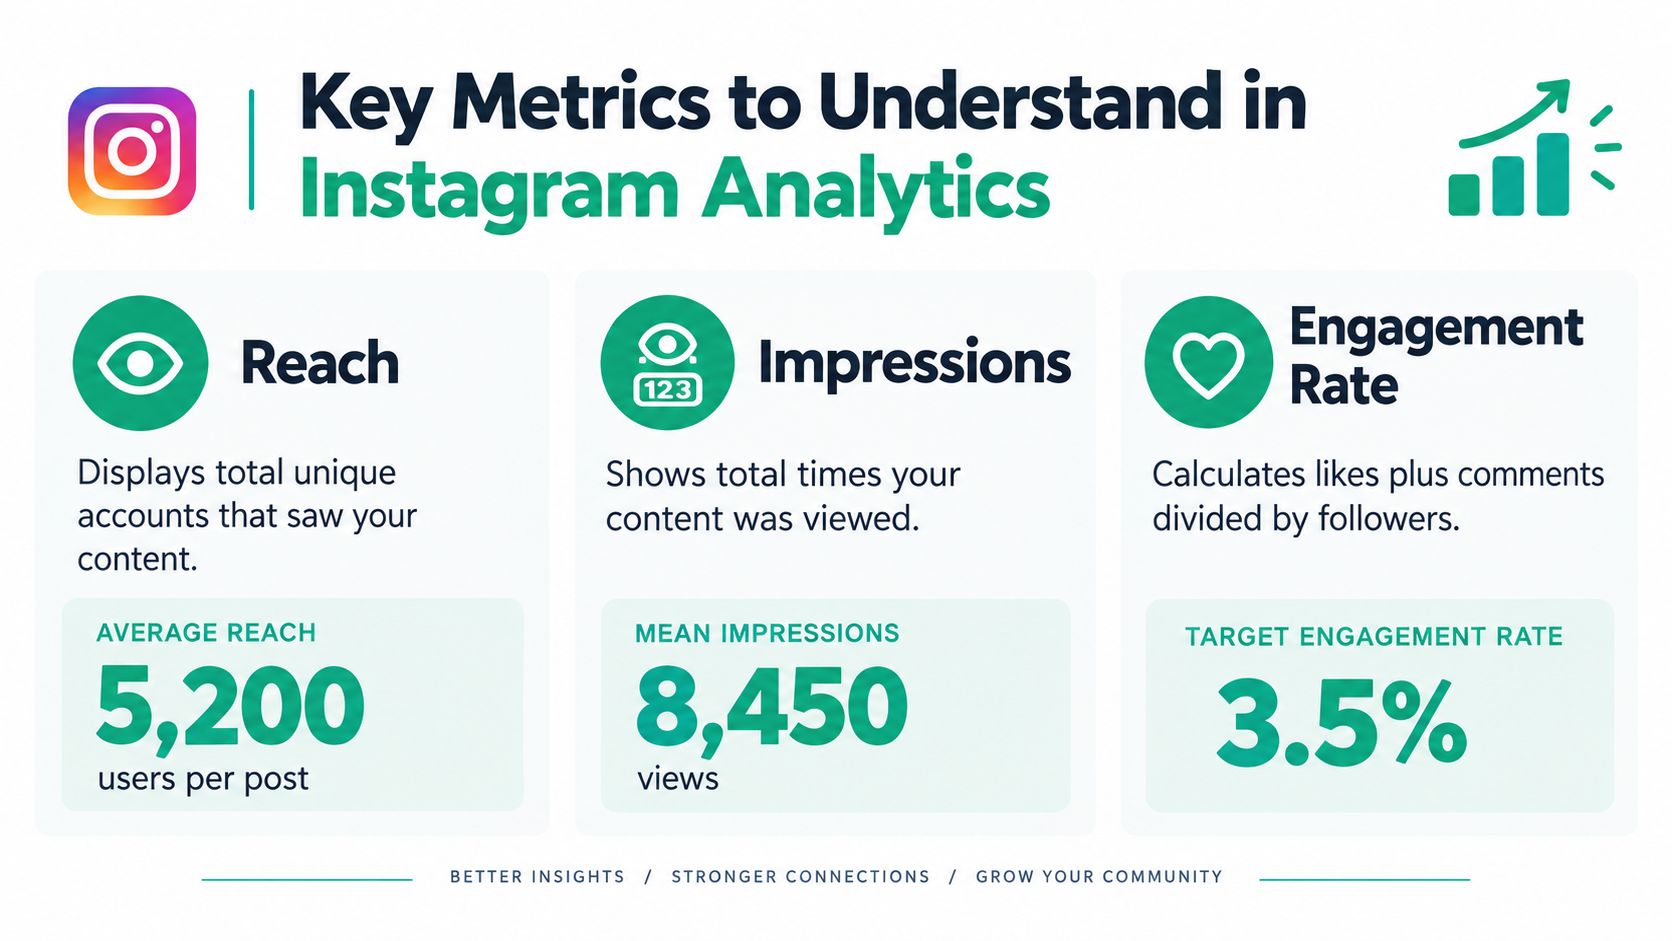
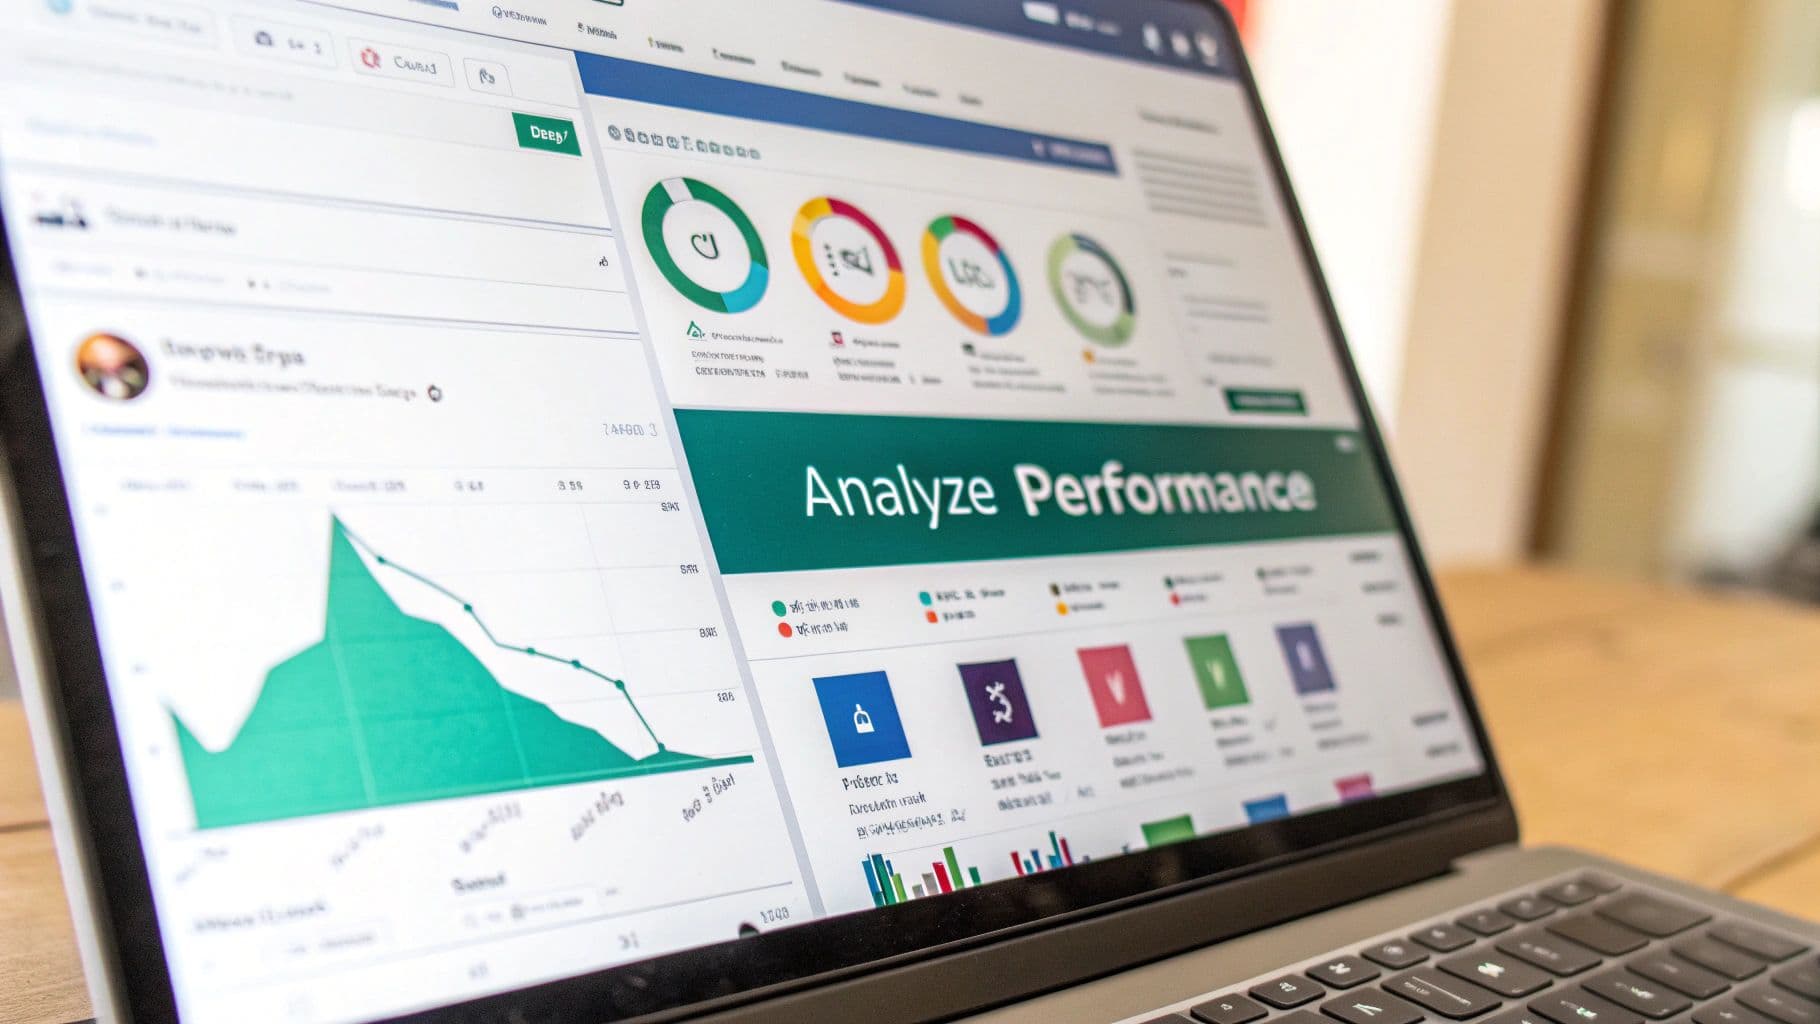
Instagram gives you plenty of numbers, but a few deserve weekly attention. Reach shows how many unique accounts saw your content, impressions show how often it was viewed, and engagement shows whether people reacted. The dashboard also ties audience data to content metrics like reach, impressions, likes, comments, engagement, and profile actions, which turns the report into something you can act on instead of just admire. Instagram platform notes
Separate exposure from response
Reach and impressions measure visibility, but they do not prove interest. A post can travel widely and still fail to earn likes, comments, or profile actions. Keep visibility and response in the same review, because the gap between them usually shows whether the content is being distributed to the right people.
For a clearer way to calculate and compare interaction quality, the social media engagement guide is a useful reference. Use it when you need a repeatable method instead of judging each post by feel.
Read the dashboard like a manager, not a fan
The fastest mistake I see is treating the follower total as the scorecard. Follower count is only the surface. The key question is whether the audience is doing anything that supports your goal. If reach rises while comments stay flat, the content is getting distribution without much pull.
The sample infographic uses Average Reach of 5,200 users per post, Mean Impressions of 8,450 views, and a Target Engagement Rate of 3.5 percent as design points, but those figures are only visual examples in the asset itself. Use the structure, not the placeholder numbers, to shape your own reporting.
If a post reaches more people but the response stays thin, change the topic before you change the format.
Interpreting Audience Demographics and Activity
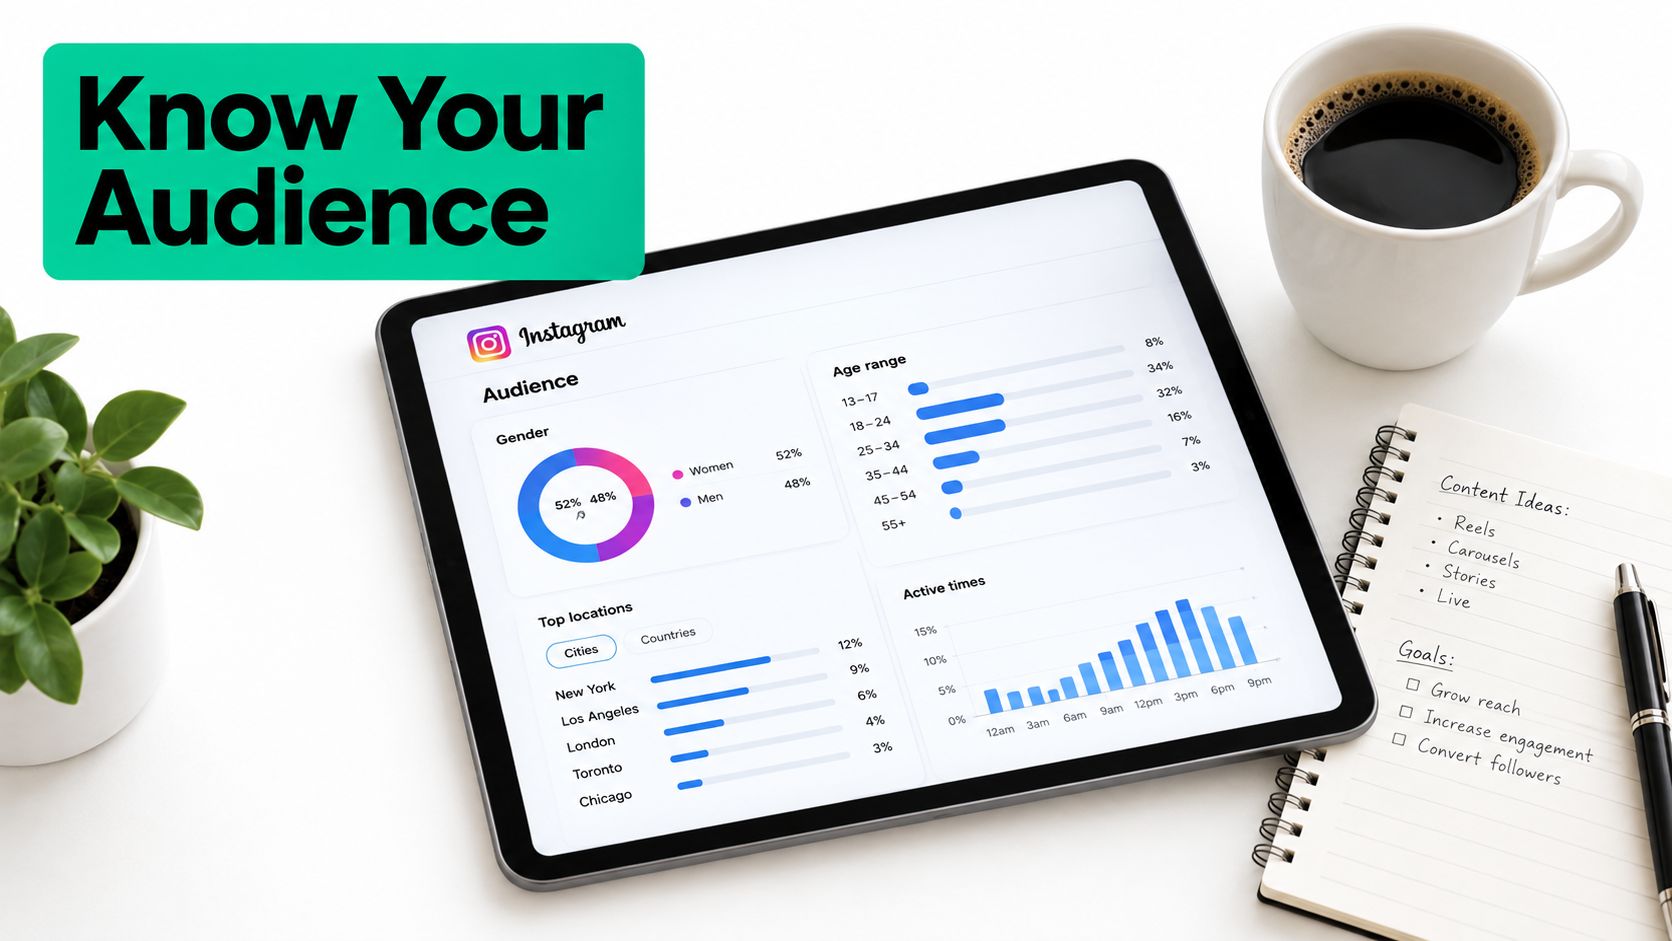
Audience data turns Instagram from a content feed into a check on fit. Review age ranges, gender, and top locations by city or country, then compare them with the market you want to reach. A local service business, a niche creator, and a global ecommerce brand can read the same chart in very different ways because each one is making a different business decision. The audience demographics guide is useful background if you want a clearer framework for that comparison.
Use demographics to test audience fit
If your profile is built for a specific persona, the demographic view shows whether the account is attracting the right mix of people. Gender, age, and location matter most when you compare them with your offer, your tone, and the subjects you post about. Aim for alignment or mismatch between your followers and your offer, rather than a demographic that merely looks better on paper.
Location often explains performance that looks inconsistent at first. Top cities and countries can show where followers live, which may differ from where you assumed your audience was concentrated. That gap often explains why certain references, offers, or posting windows work better than others.
Treat activity patterns as history, not prophecy
Instagram also shows when followers are most active by hours and days. Use that as a historical pattern, not a promise that every post will perform better at that exact moment. The data helps with scheduling, but it does not create engagement on its own.
The chart shows when people were active before. It does not guarantee they will respond the same way next time.
A practical routine is to compare demographic fit with activity timing. If your audience spans regions or time zones, the busiest hour in the dashboard may matter less than the window that overlaps with your highest-value segment. Follower data and posting schedules work best when you read them together.
Using Third-Party Tools for Advanced Analysis
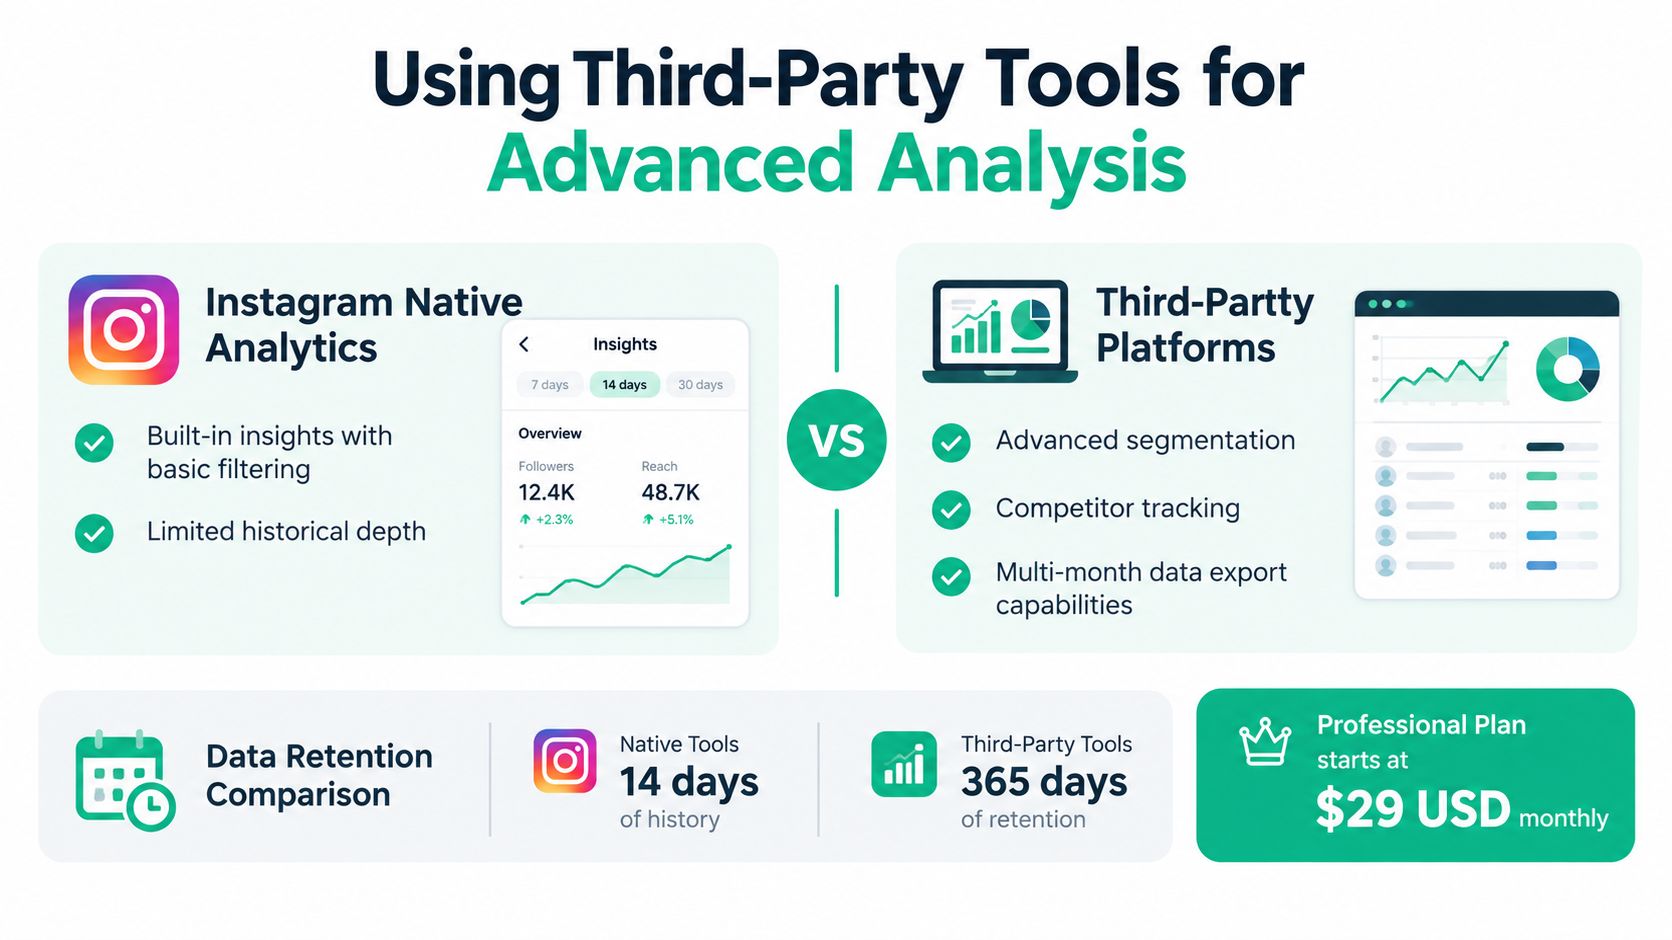
Native Instagram analytics are enough for many accounts, but they're not built for every workflow. Historical depth is limited, segmentation is basic, and competitor monitoring is not the app's strength. A dedicated tool becomes useful when you need longer retention, better filtering, or reporting across multiple accounts. Best Instagram analytics tools
Know what native tools do well
Instagram's own dashboard is strongest for quick checks, audience snapshots, and content-level feedback. If you just need to see who follows you, where they're from, and when they're active, native Insights is usually enough. It's also the most direct option because the data lives inside the app you already use.
Know what outside platforms add
Third-party analytics platforms can add broader retention, competitor tracking, exports, and more granular segmentation. The infographic comparison highlights 365 days of retention on third-party tools versus 14-day history for native tools, along with a Professional plan starting at $29 USD monthly in the example shown. Those numbers belong to the visual asset, but the practical point stands, external tools are better suited to long-view reporting and multi-account analysis. Marketing OS built on customer data
For teams that need a central system, that difference matters. A platform can help unify follower trends, campaign notes, and performance history in one place, which is useful when the people analyzing the account aren't the same people posting to it. Native Insights tells you what happened inside Instagram, while external tooling helps you compare and store that story over time.
Integrating Native Data with Automation Platforms
Native analytics tell you what your audience is doing. Automation and growth platforms help you turn that information into a repeatable workflow instead of a monthly spreadsheet exercise. That's the gap most accounts leave open, they collect data, then they post by habit.
Gainsty fits into that gap as one option for teams that want organic growth support tied to performance trends. It's relevant here because the platform is positioned around follower movement, engagement metrics, and targeted growth workflows, which makes it easier to act on audience signals instead of just watching them. The value isn't in replacing Instagram Insights, it's in connecting the numbers to a process that keeps your account moving.
Why the combination works
Instagram tells you who is there, where they are, and when they're active. A growth platform can use that context to inform targeting, content pacing, and account management around the audience you want to attract. That matters if your current followers aren't the same people you need for discovery or conversion.
When native data stays isolated, teams often optimize for the wrong thing. They focus on existing followers because those numbers are visible, but growth usually depends on reaching people beyond the current base. A combined workflow keeps the emphasis on audience fit and new reach, not nostalgia for yesterday's follower list.
Use data to steer, not just observe
The best use of analytics is directional. If demographics show your audience is drifting away from your target market, adjust topics, captions, or formats. If activity data suggests your followers cluster around certain windows, schedule accordingly, but keep testing because behavior changes.
A practical setup is simple, review native Insights for the raw signal, then use a platform like Gainsty only where it helps with execution, tracking, or repeatable growth tasks. That keeps the account human and the process disciplined.
Best Practices for Leveraging Follower Insights
Follower analytics work best when they're reviewed on a routine, not when someone remembers to check them after a weak post. The accounts that improve steadily usually treat Insights like a recurring operating habit. That means looking for patterns, not excuses.
Use a simple review checklist
Check audience fit first: Compare age, gender, and location against the market you want to reach.
Compare reach with engagement: If visibility rises but interaction stays flat, the content may be broad but not compelling.
Watch activity windows carefully: Use active hours as a scheduling input, not a guarantee of stronger performance.
Track changes over time: Look for shifts in who follows you, not just the latest snapshot.
Keep platform limits in mind: Follower demographics generally need at least 100 followers to populate, and some data can be incomplete or delayed. Instagram metrics guidance
Don't overread a small sample
A frequent mistake is treating early or partial audience data as settled truth. If the dataset is thin, delayed, or incomplete, draw cautious conclusions and keep observing. The dashboard is better at showing direction than certainty, especially for smaller accounts.
The other common mistake is confusing followers with everyone who sees or interacts with content. That matters because the people reached by a post can differ from the people already following you, and the people engaged can differ again. Use follower analytics for audience fit, reached-audience data for discovery, and engaged-audience data for content relevance.
Good analytics habits don't create growth by themselves. They just stop you from making the same bad decision twice.
If you're ready to turn Instagram follower analytics into a working growth system, explore Gainsty for organic Instagram growth support built around audience signals and performance tracking. It's a practical next step if you want to connect native Insights with a process that helps you act on what the data is already telling you.