Why Industry Benchmarks Matter More Than a Single Average
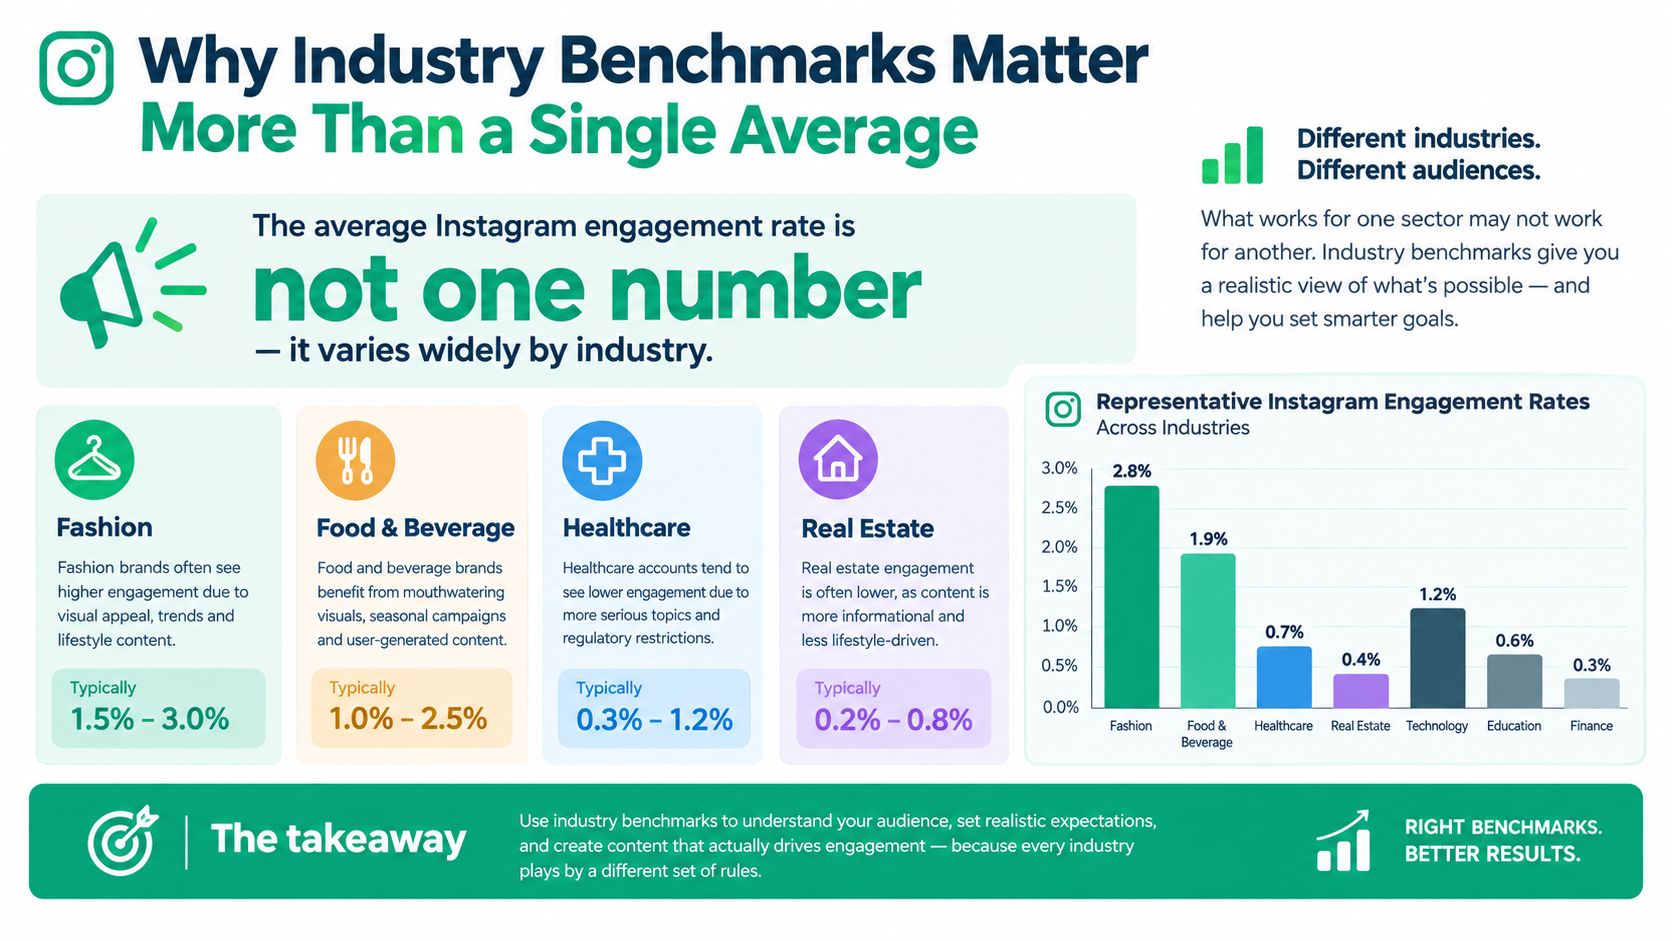
In Rival IQ's 2024 benchmark, higher education recorded a 2.43% median engagement rate, compared with a 0.43% cross-industry median. Sports teams reached 1.37%, while media and news recorded 0.32%. These figures show why “average Instagram engagement rate by industry” is a more useful question than “What's a good Instagram engagement rate?” (Rival IQ's 2024 Social Media Industry Benchmark Report)
One platform, different audience conditions
Industry affects what followers expect and how they respond. A university can draw interaction from students, alumni, and prospective applicants who share an affiliation with the institution. A retail account may reach a broader mix of shoppers, including many who follow passively or engage only when a product or promotion is relevant.
That doesn't mean every university account should achieve the higher-education median, or that retail brands should accept weak content. Benchmarks describe the middle of a measured sample, not a guaranteed outcome or a grade for an individual account. They're useful for establishing context, then investigating what's behind a result.
Rival IQ's 2024 benchmark also reported a median publishing frequency of 4.2 posts per week across industries. That's a useful description of the sampled organizations, not a universal prescription. Publishing more often doesn't automatically make posts more relevant, and posting less doesn't necessarily mean an account is neglecting its audience.
The comparison that matters: Evaluate your result against accounts with a similar industry, audience, format mix, and calculation method, not just against a broad Instagram average.
What a benchmark can and can't tell you
An industry median can tell you whether your rate is high or low relative to a selected group. It can't tell you whether your posts are driving the business outcomes you care about, such as qualified inquiries, sales, or meaningful community participation. A lower follower-based rate may coexist with strong reach or conversions, particularly when an account's audience is large or includes many passive followers.
This article presents sector figures alongside their sources and explains where the comparisons have limits. The practical goal is to help you set a fair reference point, interpret it cautiously, and use your own analytics to decide what to change.
How Engagement Rate Benchmarks Are Calculated
The same engagement rate can describe different measurement choices. A follower-based rate compares interactions with audience size. A reach-based rate compares interactions with the people who saw a post. A view-based rate uses video or content views as the base. Treating those results as interchangeable is how a single platform-wide average becomes misleading.
For a like-for-like comparison with Rival IQ's industry dataset, keep the denominator tied to followers. As noted earlier, Rival IQ describes its Instagram benchmark as measurable interactions divided by total followers, with interactions including likes, comments, favorites, shares, and reactions. If your own calculation uses reach or views, the gap between your rate and that benchmark may reflect the formula rather than performance.
Median and average answer different questions
A mean can be pulled upward by a small number of unusually strong accounts or posts. A median marks the midpoint, so half the measured observations sit above it, and half sit below. That makes the median steadier when a sample mixes large and small accounts, but it still depends on who was measured.
The sample is the part readers often skip. A dataset built from established brand accounts can behave differently from one weighted toward creators, regional markets, or high-frequency publishers. Before using a benchmark, check account type, geography, measurement window, posting cadence, and whether the report used a median or a mean.
Format can shift the comparison
Format mix can move a rate even when audience quality stays similar. Socialinsider's tracked Instagram sample showed format-level differences and a slight year-over-year decline, which is useful as evidence that carousel, Reel, and image performance can diverge inside one dataset. It should not be read as a universal ranking for every account.
Use this checklist before adopting any reference point:
Denominator: followers, reach, or views.
Counted interactions: likes and comments only, or saves, shares, replies, and reactions too.
Sample: brands, creators, regions, account sizes, and active posters.
Timeframe and cadence: one campaign window can differ from a full-year view.
Summary statistic: median, mean, or a trimmed estimate.
For the calculation itself, Gainsty's guide to the Instagram engagement rate formula and social media performance walks through the formula. Apply one formula consistently in your own reporting, then choose a benchmark measured the same way.
Industry-by-Industry Engagement Rate Benchmarks
A sector median is only useful when the report, year, and measurement basis stay attached to the number. The table below keeps those labels visible because Rival IQ and Dash Social do not publish interchangeable benchmarks. Rival IQ reports follower-based medians by industry, while Dash Social's 2025 view reflects a different sample and calculation basis, so the rows should be read as reference points rather than clean equivalents.
Recent industry benchmarks show a wide spread in Instagram engagement rates. Rival IQ reports higher education at 2.1% in 2025 and 2.43% in 2024, while sports teams reached 1.3% in 2025 and 1.37% in 2024. In Rival IQ's 2025 data, nonprofits posted a median rate of 0.56%, health and beauty 0.44%, media 0.44%, food and beverage 0.40%, financial services 0.26%, and retail 0.16%. Rival IQ's 2024 report also listed media and news at 0.32%, technology at 0.38%, fashion at 0.54%, food and beverage at 0.79%, and retail at 0.44%. In Dash Social's 2025 dataset, travel and hospitality came in at 1.0%, while consumer packaged goods recorded 0.7%.
Rival IQ's 2025 cross-industry median was 0.36%, based on interactions divided by followers, while its 2024 report showed 0.43%. Dash Social's 2025 Instagram view put the overall rate at 0.6%, with industry figures spanning 0.5% for beauty and children-and-baby accounts to 1.0% for travel and hospitality. Those totals already warn against borrowing one platform average and applying it everywhere.
Read the table as context, not a league table
The practical comparison is inside one methodology. Within Rival IQ's recent industry set, higher education and sports teams sit high, financial services and retail sit below the cross-industry median, and several consumer sectors cluster closer to the middle. A retailer should compare retail rows before comparing itself with a university.
Year gaps matter as much as sector gaps. Retail's Rival IQ median moved from 0.44% in 2024 to 0.16% in 2025, while food and beverage moved from 0.79% to 0.40% across the same reports. Those changes can reflect sample shifts, posting cadence, category definitions, or measured performance, so they show benchmark movement rather than a guaranteed decline for every account.
Use the closest row as a boundary condition. If your account already sits above its sector median, the more useful question is whether your denominator, audience mix, and format exposure make the comparison fair.
Why Higher Education and Sports Lead Engagement
Higher education and sports teams top Rival IQ's 2025 follower-based industry medians at 2.1% and 1.3%, both well above the 0.36% cross-industry median shown in the benchmark table earlier. A gap that size is unlikely to come from posting technique alone.
The better explanation is the nature of the audience itself.
Shared identity gives people a reason to respond
University accounts speak to overlapping communities: students, alumni, families, staff, and prospective applicants. Campus achievements, traditions, and institutional news give those groups material that feels personally relevant. Followers are responding to a community they belong to, not just consuming content about a subject.
Sports teams hold a similar advantage. Fans arrive with a strong attachment to the team, its players, and its results, so match-related moments invite immediate reaction and shared milestones travel quickly through an affiliated audience. These explanations fit the observed pattern, though benchmark data alone cannot prove which tactic produced the medians.
The same dataset offers one more clue. As noted earlier, higher education reached the top median while posting less often than the typical account in the sample, which cautions against assuming higher volume produces higher engagement. It points toward relevance and audience affinity without establishing a universal ideal schedule.
Borrow the principles, not the surface content
Brands outside education and sports can apply the underlying approach without copying campus tours or game-day posts. Start by naming the community the account serves and the subjects that make members feel included. A financial brand might walk through a decision its customers regularly face. A retailer could center posts on how customers use a product. A local service business could show the people and places behind its work.
The planning question that follows is simple: what gives this audience a reason to care, contribute, or share? Framing content decisions around that question shifts effort away from raw volume and toward posts with a clear audience connection.
A practical review can test each post against three checks:
Shared interest: does it speak to a real customer need, identity, or community?
Meaningful response: can followers add an opinion or experience, rather than just tap a generic prompt?
Clear purpose: is the post useful, timely, or personally relevant to the people it should reach?
Those checks will not turn a retailer into a sports team. They can raise relevance inside the account's own vertical, which is the comparison a realistic benchmark is built for.
What Lower Engagement Industries Tell Us
Rival IQ's 2025 follower-based medians place retail at 0.16% and financial services at 0.26%, both below the 0.36% cross-industry median. Media and health and beauty each recorded 0.44%, while food and beverage reached 0.40%. (Rival IQ's 2025 industry results)
A rate below the cross-industry median doesn't automatically mean a brand's content is weak. A retail account at 0.36%, for example, would be above Rival IQ's 2025 retail median, although it would match the report's cross-industry median. The same follower-based rate could represent a different relative result for a higher-education account. The benchmark's job is to add context, not to replace judgment.
A low percentage can hide useful performance
Follower-based rates can fall when an account grows beyond its most active audience. New followers may include people who rarely interact, so the denominator grows without a matching rise in likes, comments, saves, or shares. The account may still be reaching people, attracting relevant visitors, or generating inquiries. That's why engagement rate should sit alongside measures tied to the account's goals, rather than serving as the sole definition of success.
Structural conditions can also shape results. Retail content may serve a broad customer base with varied interests. Financial services posts often need to build trust and explain complex topics, while media accounts may publish across many subjects for audiences with different preferences. Those factors can make interaction less uniform, but they aren't excuses to ignore audience response. They're reasons to examine which content connects with which segment.
Check whether interactions are genuine
An unusually high interaction count doesn't always indicate genuine audience interest. If comments look repetitive, irrelevant, or detached from the post, inspect their quality before treating the rate as evidence of strong performance. For a practical overview of common signs and origins of inauthentic comments, see where Instagram fake comments come from.
For lower-engagement sectors, compare posts by topic and format rather than judging the account from one blended rate. Look for whether particular posts generate saves, shares, profile visits, or inquiries, then assess whether those actions matter to the account's objective. A small amount of meaningful interaction may be more valuable than a larger volume of low-intent activity.
Interpret the percentage in context: A benchmark can flag a question to investigate. It can't tell you, by itself, whether the audience is the right one or whether the content is producing business value.
How to Benchmark Your Own Instagram Account
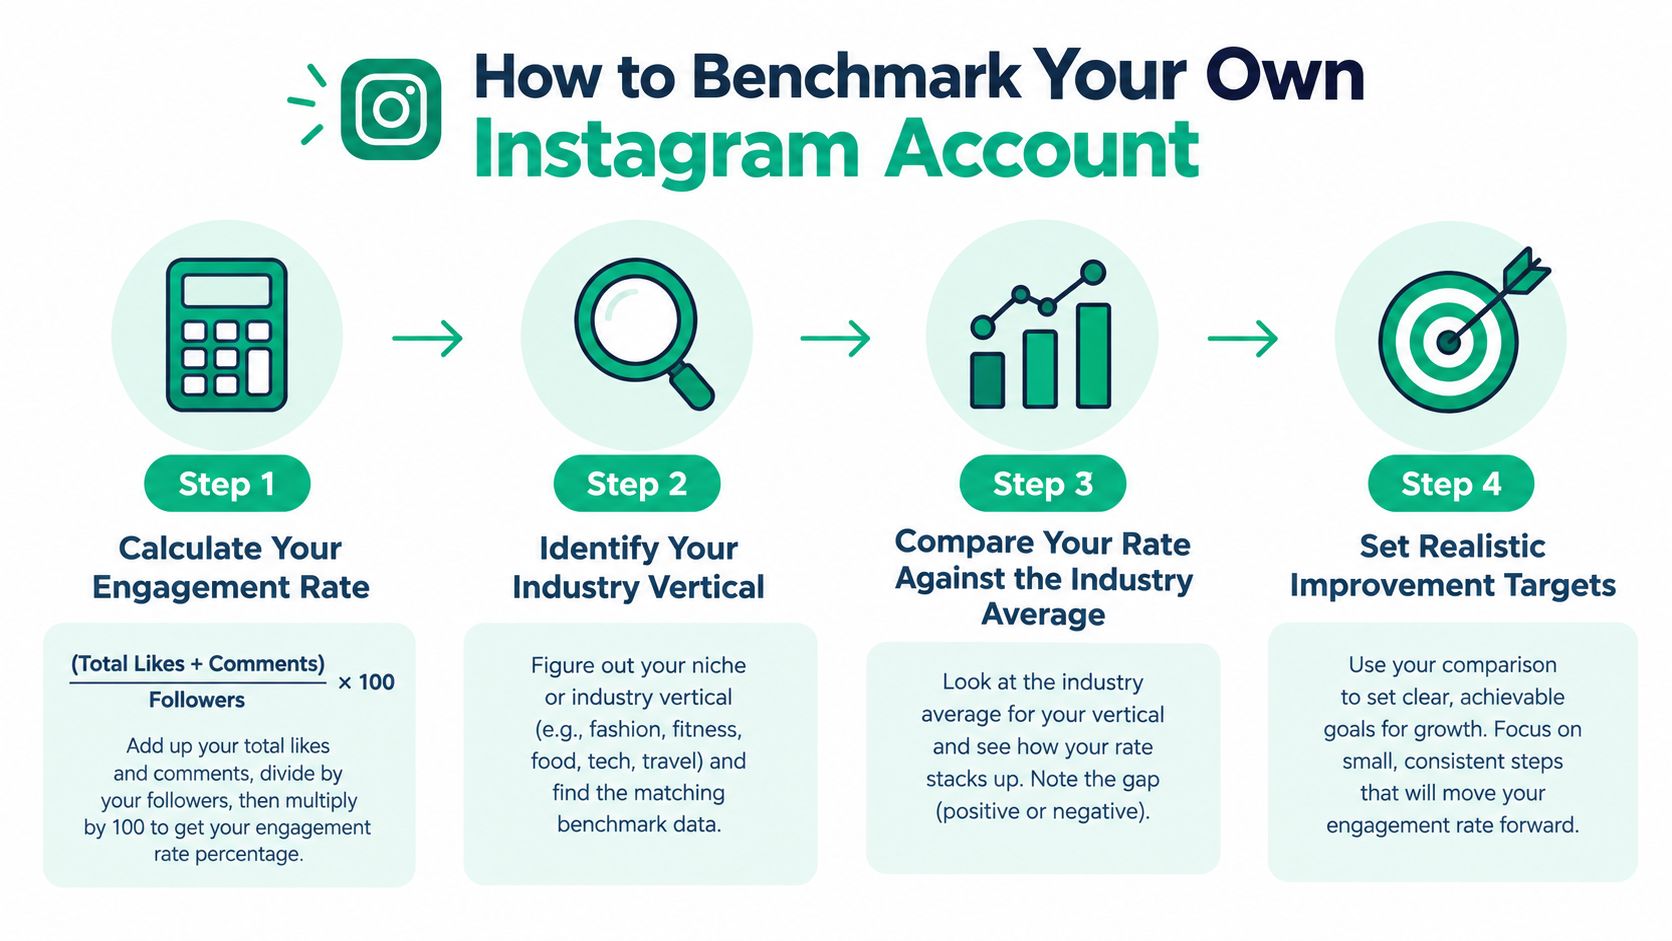
Benchmarking fails most often at the denominator. Before computing anything, decide which question you are answering: how engaged your follower base is, or how engaged the people who saw a post were. Follower-based and reach-based rates measure different things, and mixing them produces a comparison that looks precise while meaning very little.
Follow a like-for-like process
Identify your comparison group. Choose the closest industry category and note whether your account is a brand, creator, or organization. A general sector label can conceal important differences, so narrow it where the benchmark offers a relevant subgroup.
Match the calculation. If you are comparing against the Rival IQ dataset cited earlier, use the follower denominator and the same interaction set that study counted. Substituting reach or views shifts the yardstick without telling you.
Control for posting frequency and content mix. Compare over a consistent window and record whether your posts are mostly Reels, carousels, or images. As noted earlier, published format-level results differ across these formats, so a Reel-heavy account measured against an image-heavy median is not a fair test.
Track the median, not only the average. One viral post can pull an average upward while typical performance stays flat. A median across a fixed set of posts shows what your account delivers, and it is worth revisiting whenever your audience, format mix, or goals change.
For a broader walkthrough of account reporting, see Gainsty's guide to Instagram analytics for business. If your team also monitors ratings and review channels, compare review performance benchmarks as a separate exercise. Reviews and engagement measure different signals, so keep their definitions distinct.
Why does the denominator caution matter so much? The figures cited earlier come from different samples. Rival IQ's cross-industry median of 0.36% and its 2.1% for higher education describe follower-based engagement across its sample, while the Dash Social figures of 2.3% for images, 2.7% for Reels, and 2.9% for carousels come from a separate dataset of nearly 3,000 companies using its own methodology. Neither is wrong. They answer different questions, which is exactly why your own calculation has to match the source you benchmark against.
Then act on what the comparison shows. If your rate sits above the relevant vertical median, protect the content patterns producing it and check whether the interactions support business goals. If it sits below, isolate the gap by format, topic, frequency, or audience quality before changing your publishing strategy.
Tailored Engagement Strategies for Each Vertical
Benchmarks describe differences between industries, but they don't prescribe a content calendar. The stronger approach is to connect your sector's audience needs with formats and stories that make interaction natural. A university can build around community, while a financial services account may need to make useful information easier to understand and act on.

Lead with what your audience cares about
Education and nonprofits can make people, mission, and community activity central. Share stories that give followers a clear point of connection, such as a learning milestone or the people behind a program. Invite responses that add to the story rather than asking for a generic reaction.
Sports teams can create opportunities for fans to participate around moments that already matter to them. Show preparation, reactions, and community involvement, then use captions that invite genuine fan perspectives. Keep the content anchored in the team and its supporters rather than relying on prompts that could fit any account.
For food and beverage, focus on the choices and experiences followers can use: how a dish is made, how a product fits into a meal, or what makes a local place distinctive. Useful, clear visuals can give people a reason to save or share a post without depending on elaborate production.
Adjust the approach to the decision followers face
Retail and fashion accounts can pair product visuals with practical context, such as how an item works in a real setting or how different options compare. A product post has a stronger reason to earn attention when it helps a follower make a decision, not only when it displays the item.
Technology and financial services accounts can reduce abstraction by showing a product or idea in use. Break a complicated topic into clear, focused posts, explain terms plainly, and prioritize trust over hard-to-verify claims. In these sectors, a useful explanation may matter even when the account's headline engagement rate is lower than a high-affinity category.
Travel and hospitality accounts can show places through the experiences people might have there, while real estate professionals can make local knowledge as visible as the listing itself. For agents building a location-focused content plan, this marketing guide for realtors offers a relevant starting point. Across verticals, the principle is consistent: match the post to the audience's interest and the action you want them to take.
There's no single format that every industry should adopt. Socialinsider's 2025 findings showed differences among Reels, carousels, and images in its sample, but that doesn't establish a universal winner for every niche or account. Test formats against the same audience and objective, then keep the ones that bring useful responses. For more ideas grounded in different engagement goals, review these Instagram engagement strategies.
Frequently Asked Questions About Engagement Benchmarks
What's a good engagement rate for a small or new account?
There isn't one reliable cutoff that applies to every account. Start with the closest industry benchmark, then compare your follower-based rate with accounts that use the same formula and a similar account type. A small or new account may have a highly engaged audience, but its rate still needs context rather than an automatic pass or failure.
How often should I re-benchmark?
Revisit the comparison when your audience, posting approach, or business goals change, and review performance consistently in between. Use the same calculation and a comparable period each time. That helps you distinguish a real shift in your own account from a change in formula or sample.
Do Reels or carousels usually get higher engagement?
The answer depends on the benchmark and the account. Socialinsider reported 0.55% for carousels, 0.52% for Reels, and 0.37% for image posts in its 2025 format-level results. Those are findings for its sample, not a guarantee that the same ranking will hold for your industry or audience. (Socialinsider's Instagram benchmark data)
What if my engagement rate is declining while reach grows?
Read both metrics together. Reach indicates how many people encountered content; a follower-based rate indicates interactions relative to your follower count. If reach is growing while the rate declines, investigate whether content is reaching more people who don't follow the account or whether your follower base includes more passive users. Then assess the business outcomes you care about instead of treating either metric as the full story.
Is engagement by reach the same as engagement by followers?
No. Engagement by reach compares interactions with the people who saw a post. Engagement by followers compares interactions with the account's follower count. A smaller, highly relevant audience can generate meaningful responses even when its follower-based rate doesn't match a different account's. Keep the formulas separate and compare each rate with a benchmark that uses the same denominator.
Use the benchmark closest to your industry and calculation method, then track your own results by format and audience response before changing course. Gainsty offers Instagram growth guidance, analytics, and custom strategies for different industries and niches; visit Gainsty to explore whether its tools fit your account's needs.