Why Follower Count No Longer Equals Influence
Follower count still gets the spotlight because it's visible, simple, and easy to compare. But it's also one of the easiest Instagram numbers to misunderstand.
A large audience doesn't guarantee attention. It only tells you how many people chose to follow at some point. It doesn't tell you who still notices your posts, who saves them, who shares them, or who cares enough to act. That's the core shift behind modern Instagram analytics engagement.

Why vanity metrics keep fooling people
Follower count feels like proof of influence because it's public. Engagement signals are less obvious unless you open your insights and look closely.
That's why many smart marketers now separate vanity metrics from decision-making metrics. If you want a clean framework for that distinction, Cometly's actionable marketing metrics guide is useful because it shows how to judge a metric by whether it changes your next move.
Practical rule: If a metric makes you feel successful but doesn't tell you what to do next, treat it carefully.
A creator with a smaller but active audience may get more saves, shares, and real conversations than an account with a much bigger following. A local business may care less about broad visibility and more about whether engaged viewers turn into inquiries. A brand may need content that earns repeated interaction, not just profile visits.
What influence looks like now
Real influence on Instagram is more behavioral than visual. You're looking for signs that people didn't just scroll past.
Here's what matters more than raw audience size:
Content response: Are people liking, commenting, saving, or sharing?
Audience fit: Does the content attract the people you want to reach?
Consistency: Do strong posts happen by accident, or can you repeat the pattern?
Outcome alignment: Does engagement support your real goal, whether that's trust, traffic, bookings, or brand affinity?
That's the useful lens for Instagram analytics engagement in 2026. Not “How many followers do I have?” but “What are my followers, and non-followers, doing?”
Understanding Instagram Engagement Metrics
Before you can improve engagement, you need to know what each signal means. Many people treat all interactions as equal. They aren't.
The four interactions most people confuse
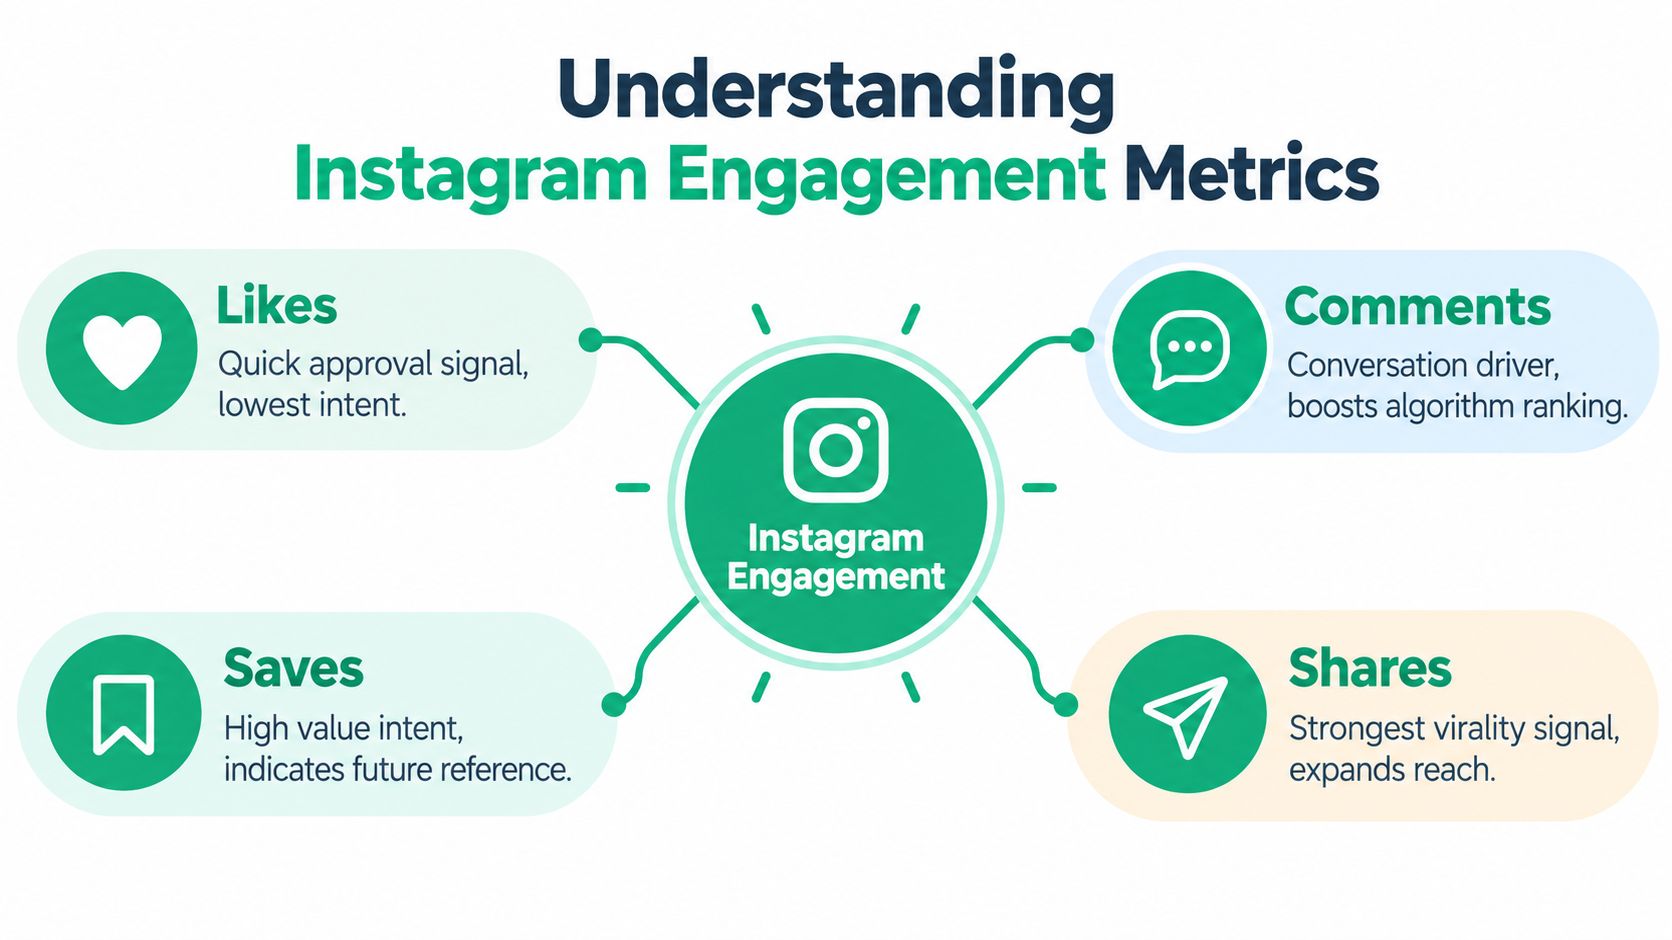
Likes are the lightest signal. They show quick approval, but not much depth. Someone may like a post in a second and never think about it again.
Comments show stronger intent. They take more effort and often reflect either curiosity, agreement, or community. When comments become conversations, that's usually more meaningful than a pile of passive likes.
Saves are often underrated. A save suggests the user wants to revisit the content later. Tutorials, checklists, recipes, style guides, and how-to posts often perform well here because they have lasting utility.
Shares are the strongest advocacy signal in many situations. A share means someone thought your content was worth passing to another person, group, or Story. That often tells you more about content value than likes do.
For a broader foundational explanation, PostSyncer's guide to engagement metrics is a solid companion read.
Reach and impressions are not the same
Many beginners get lost.
Reach means how many unique accounts saw your content. -
Impressions mean the total number of times your content was displayed, including repeat views.
If one person sees your post three times, that usually counts as one reached account but multiple impressions. That difference matters because it changes how performance feels. Deep impressions can look exciting, but if reach stays modest, the same people may just be seeing the post repeatedly.
A helpful next read is Gainsty's breakdown of Instagram insights explained, especially if you want a more app-level view of where these numbers live inside Instagram.
Why engagement rate formulas cause confusion
When people say “my engagement rate,” they often assume there's one universal formula. There isn't.
Some teams calculate engagement against followers. Others compare engagement to reach or views. Each approach answers a different question:
There are three common ways to calculate engagement rate, and each one answers a different question. Engagement by followers shows how a post performed against your total audience size, which makes it useful for judging post-to-post consistency. Reach shows how people responded after actually seeing the post, which makes it especially useful for organic content analysis. Views show how viewers interacted with video content, which is why it is commonly used for reviewing Reels and other video posts.
A metric isn't wrong just because it differs from another dashboard. It may be using a different denominator.
That single insight clarifies a lot of Instagram analytics engagement confusion. If two tools show different rates, the issue may not be bad data. It may be different math.
How to Interpret Your Analytics Data Correctly
Most Instagram mistakes happen after the data shows up. People see a number, react emotionally, and make the wrong adjustment.
The better approach is slower and more disciplined. Ask what the metric is measuring, what context produced it, and whether the comparison is fair.
Start with benchmark reality, not wishful thinking
Instagram engagement is now a small-number game. Socialinsider's 2026 benchmark study, based on 35 million Instagram posts from 447,613 profiles, reported a platform-wide engagement rate of 0.48%, down 24% year over year, with Q2 2026 dropping further to 0.45% across all three content formats, according to Socialinsider's Instagram benchmark analysis.
That matters because many people still evaluate their content against outdated expectations. They assume anything under a few percentage points must be bad. On today's Instagram, that assumption can distort your decisions.
If your account posts in a crowded niche, reaches lots of non-followers, or leans into discovery-heavy formats, a lower-looking rate may still reflect strong distribution. If your audience is small and highly specific, a similar rate may signal a different story.
Compare like with like
A smart comparison has to hold the right variables steady.
Don't compare:
A Reel to a static image and assume the difference came from the topic alone
A promotional post to an educational post and blame the caption first
A follower-based rate to a reach-based rate as if they mean the same thing
Do compare:
Similar topics across similar audience segments
The same format over multiple posts
Posts published in comparable time windows
Metrics that use the same denominator
Your analytics become useful when you remove the unfair comparisons that create false panic.
Read numbers through account goals
A creator, a retailer, and a local consultant can post the same engagement rate and have completely different business implications.
Here's a simple way to interpret results:
Different account types should prioritize different signals. For a creator, the strongest signals are usually saves, shares, and comments because they often show audience connection and content value. For a brand, it makes more sense to watch reach alongside engagement quality because visibility matters, but so does response depth. For a service business, comments, DMs, and profile actions are often the most useful signals because they tend to connect more directly to inquiries.
One more layer matters too. Small improvements in engagement can be meaningful now because the overall platform benchmark is compressed. When rates are low across the board, moving from weak resonance to solid resonance may look subtle in percentage terms but still represent better audience fit.
That's the big shift in Instagram analytics engagement. You're not judging content by whether it “went viral.” You're judging whether it performed better than your usual baseline, in the right format, with the right audience, for the right objective.
Tracking Engagement Trends Over Time
A single post can mislead you. A pattern rarely does.
That's why trend tracking matters more than daily score-checking. If you only react to individual posts, you'll overcorrect constantly. If you track behavior over time, you'll spot what's changing.
Why long-term tracking got harder
Instagram's benchmark decline isn't limited to one dataset. Buffer's 2026 analysis of 52M+ posts found Instagram's median engagement rate dropped from about 7.3% in 2024 to about 5.4% in 2025, a 26% decline that moved Instagram from first place to third in its dataset, as noted in Buffer's state of social media engagement 2026.
The important lesson isn't just that engagement fell. It's that measurement frameworks differ. One source may use follower-based medians. Another may report platform-wide benchmarks with a different denominator. That means trend tracking inside your own account is often more useful than chasing someone else's ideal number.
Build a rhythm you can keep
You don't need a giant reporting system. You need consistency.
Try a simple routine:
Once a week: Review your recent posts for saves, shares, comments, and overall engagement rate.
Once a month: Look for repeated patterns by topic, format, and posting window.
Once a quarter: Decide what to reduce, what to repeat, and what to test next.
This works because it keeps your analysis close to your publishing cycle. You're not waiting forever to learn, but you're also not reacting to every bump.
What to put on your tracking sheet
Keep the structure simple enough that you'll maintain it.
A useful log often includes:
Post type: Reel, carousel, or image
Topic angle: Tutorial, opinion, product, behind-the-scenes
Primary response: Which action stood out most
Context notes: Timing, offer, collaboration, seasonal relevance
Watch for repeated behavior, not isolated spikes. One breakout post can flatter you. Five posts with the same audience response can teach you something.
The goal of Instagram analytics engagement tracking isn't constant surveillance. It's pattern recognition. When you notice a format slipping, a topic rising, or a type of caption triggering more conversation, you gain a practical edge that raw posting volume can't replace.
Optimizing Content Format for Maximum Engagement
Format is one of the few levers you can change quickly without changing your whole brand. That's why it deserves more attention than it usually gets.
Many teams keep debating hooks, hashtags, or caption length while ignoring a more basic question. Did we package this idea in the right format?
The strongest case for testing format first
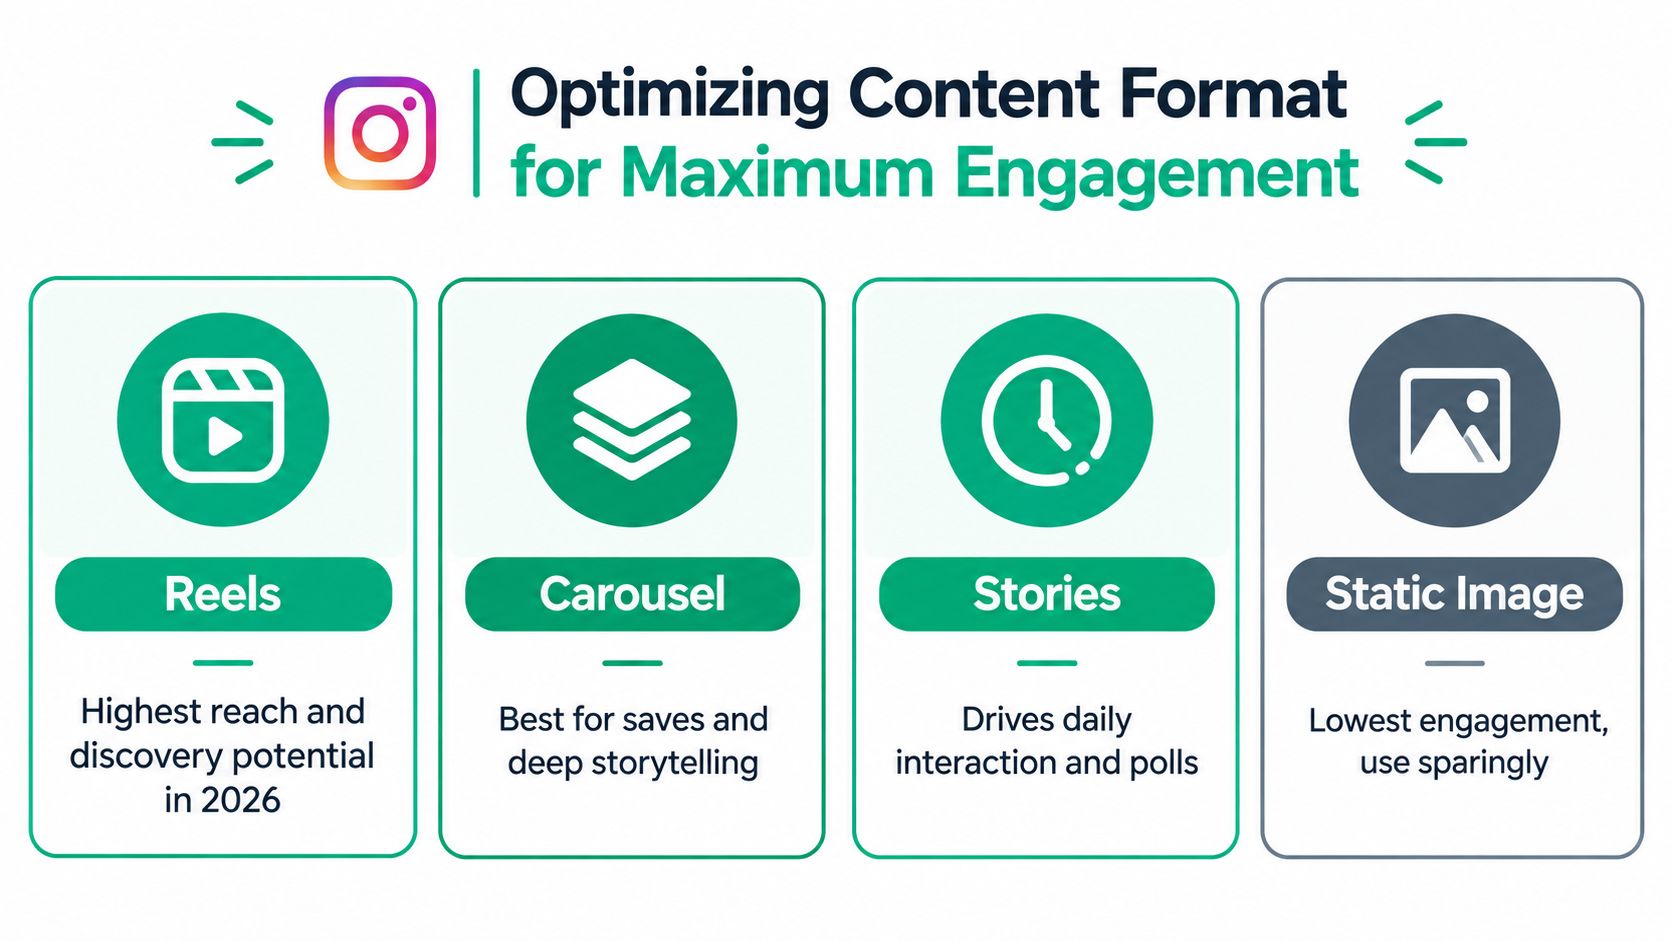
In Socialinsider's Q2 2026 benchmark, carousels averaged 0.50% engagement, Reels 0.48%, and single images 0.33%, according to Socialinsider's Instagram engagement report. That gap is why static images can drag down performance even when the topic itself is good.
Carousels often create more room for curiosity, progression, and saves. Reels can drive discovery and motion-led attention. Single images still have a place, but they usually need stronger visual or emotional punch to compete.
For anyone leaning harder into video discovery, Gainsty's article on Instagram Reels in 2026 adds helpful context.
A simple comparison
Among the main feed formats, carousels averaged 0.50% engagement and tend to work well for step-by-step ideas and swipe-driven attention. Reels averaged 0.48% engagement and are especially useful for discovery and motion-based storytelling. Single images averaged 0.33% engagement. They are simple to publish, but they typically produce weaker average interaction than carousels or Reels.
How to test formats without muddying the results
Most format tests fail because too many variables change at once. If your Reel has a stronger topic, better timing, and a clearer call to action than your image post, you didn't test format. You tested everything.
Use cleaner experiments:
Keep the topic constant: Teach the same idea as a Reel and a carousel.
Hold the caption style steady: Don't make one version much stronger.
Use similar timing: Post in comparable audience windows.
Track the dominant interaction: Saves for educational posts, shares for opinion content, comments for community prompts.
The goal isn't to prove that one format is universally best. It's to discover which format helps your audience respond to your ideas.
Stories matter too, especially for routine interaction and low-friction feedback. But for feed content, carousels and Reels are usually the first places to optimize if you want stronger Instagram analytics engagement without reinventing your content themes.
Real Engagement Strategies for Different Niches
The same dashboard can lead three different businesses to three different decisions. That's why generic advice falls apart so quickly.
A creator, an e-commerce brand, and a service business may all want “better engagement,” but they don't need the same kind of engagement.
Creator example
A lifestyle or education creator usually benefits most from saves, shares, and comments. Those signals often reflect relevance, usefulness, and community.
If a creator posts a carousel called “3 outfit formulas for busy mornings” and sees strong saves, that's a clue the audience values repeatable content. If a talking-head Reel gets views but weak saves, it may be entertaining without being sticky. For this kind of account, Instagram analytics engagement should answer: “What makes people return, remember, or recommend?”
Useful creator adjustments often include:
Turning opinions into carousels so people can swipe and save
Writing captions that invite stories instead of one-word replies
Repeating high-utility themes in fresh angles
E-commerce brand example
A product brand often needs to balance engagement with attention quality. Reach matters, but shallow interaction doesn't tell the whole story.
A skincare brand, for example, might find that ingredient education earns saves, while before-and-after style content drives shares. Product-only images may look polished but generate weaker interaction. That doesn't mean the product is the problem. It may mean the content isn't helping people imagine use, understand value, or pass the idea along.
For brands, the better question is often: “Which content helps people move from awareness to consideration?”
Service business example
A consultant, local clinic, real estate agent, or coach should usually look for signals closer to trust and intent.
Comments that ask follow-up questions matter. DMs matter. Profile actions matter. A service business may not need broad creator-style sharing if the right viewers are reaching out after seeing a clear, credible post.
Here's a practical niche snapshot:
The best engagement clues and content styles vary by niche. For a creator, the most useful signals are saves, shares, and comments, and the strongest content often includes educational carousels and relatable Reels. For e-commerce, it is more useful to focus on shares, saves, and reach quality, with strong performance often coming from product education, use cases, and comparisons. For a service business, the most valuable signals are usually comments, DMs, and profile actions, while winning content often centers on trust-building tips, myth-busting, and local relevance.
Strong Instagram analytics engagement isn't one universal pattern. It's the pattern that matches your business model.
That's the shift beginners usually need most. Stop asking what Instagram rewards in general. Start asking which audience action matters most for your kind of account.
Your Next Steps for Analytics Mastery
They don't need more analytics. They need a better way to use the analytics they already have.
The strongest habit is simple. Measure with context, test one variable at a time, and repeat what earns meaningful response.
Use a three-part operating system
Start with this:
Know your baseline: Review your recent content and find your normal range. Not your best post. Not your worst one. Your usual.
Run controlled experiments: Test format, topic angle, posting window, or call to action. Change one major variable at a time so the result teaches you something.
Iterate based on behavior: When people save certain posts, make more reference-worthy content. When they comment on contrarian takes, develop that voice. When they watch but don't act, rework the packaging or intent.
This approach keeps Instagram analytics engagement practical. You're not collecting numbers for reporting theater. You're collecting signals that guide your next post.
Pick tools that support decisions
A dashboard is only helpful if it makes patterns easier to see.
Some teams use spreadsheets. Others prefer native Instagram insights. Others want a dedicated reporting layer. If you're comparing options, Gainsty's overview of the best Instagram analytics tools can help you sort through what different platforms emphasize.
If you run Instagram as part of a broader marketing system, it also helps to connect social performance to budget thinking. A planner like Sight AI's AI-powered SEO budget planner is useful for that broader discipline because it nudges you to think in terms of resource allocation, not just content output.
What to do this week
Don't overhaul everything at once. Start with a small audit.
Try this short checklist:
Review your last batch of posts: Which ones earned the most meaningful interaction?
Group them by format: Are carousels, Reels, or images carrying your results?
Look for one repeated theme: Utility, emotion, opinion, demonstration, or story.
Plan one clean test: Same idea, different format.
Record what happened: Then adjust from evidence, not instinct
Analytics mastery isn't about becoming obsessed with dashboards. It's about becoming harder to fool. Once you understand what your metrics are really saying, your strategy gets calmer, sharper, and more effective.
That's advantage in 2026. Not bigger numbers at a glance. Better judgment behind the numbers.
If you want help turning analytics into better Instagram growth decisions, Gainsty offers tools and guidance focused on organic engagement, audience targeting, and performance tracking. It's built for people who want to understand what's working, improve content strategically, and grow without relying on fake followers or bots.