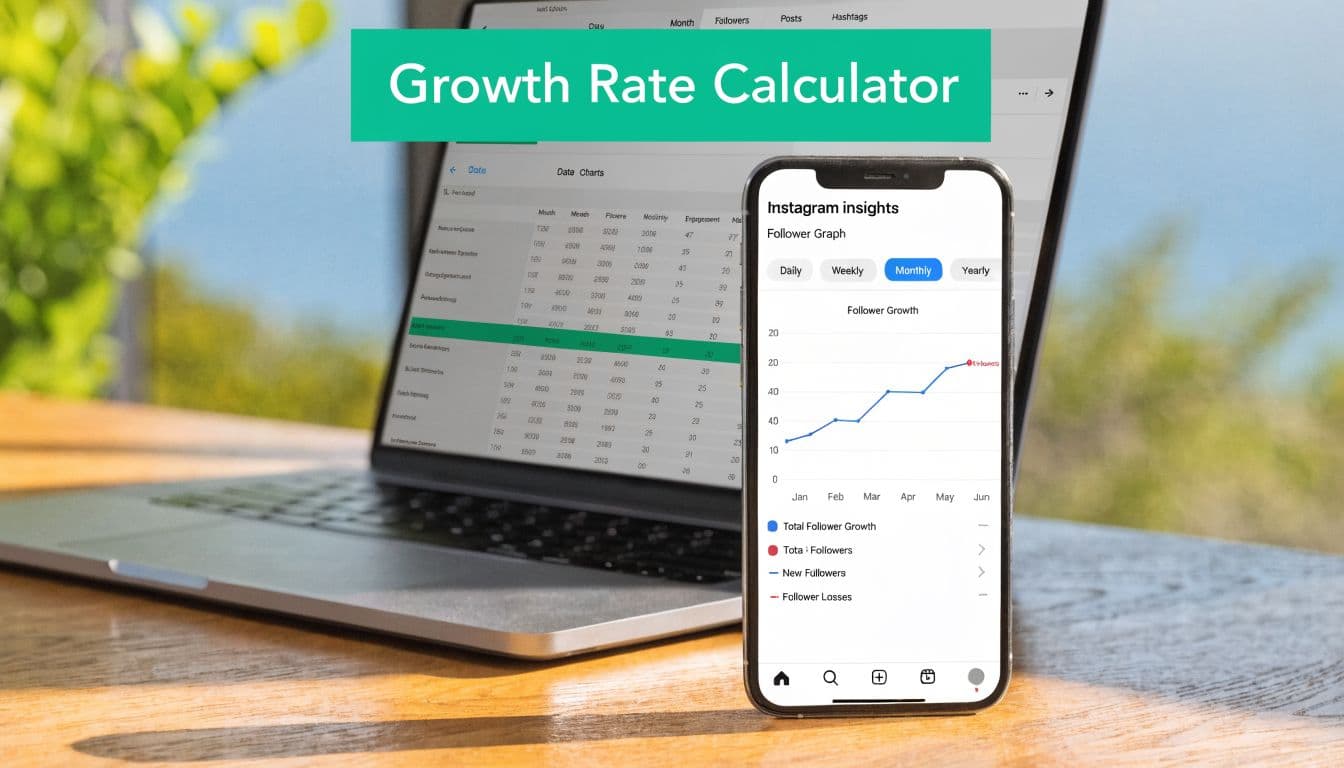
Beyond the Follower Count: The Metric That Matters
A follower's total is static. Growth rate shows movement.
That difference matters because a bigger account can add more followers in raw terms and still perform worse than a smaller one on a percentage basis. The standardized approach behind follower growth calculators is (net new followers ÷ beginning follower count) × 100, which normalizes growth across accounts of different sizes, as outlined by Dataflo's follower growth rate reference.
Why percentages beat raw follower gains
If you only track total followers, you miss the performance signal. A number like “we gained 100 followers” sounds useful until you compare it against the size of the account that produced it.
That's why social teams rely on growth rate instead of count alone. It gives you a cleaner benchmark for progress and makes month-to-month comparisons more honest.
Practical rule: Raw follower gains are descriptive. Growth rate is diagnostic.
There's another reason this metric matters. Follower growth doesn't exist in isolation. It sits next to engagement, reach, content quality, and conversion behavior. If your account is adding followers but engagement is slipping, the audience mix may be changing. If growth slows while engagement improves, you may be attracting fewer but better-fit followers. That's why it helps to pair this metric with Instagram engagement rate formulas and performance analysis.
What the number should help you decide
A good calculator isn't just there to satisfy curiosity. It should support decisions like these:
Content decisions: Which posts or themes attract followers
Campaign evaluation: Whether a launch, collaboration, or promotion translated into audience growth
Trend spotting: Whether your account is improving, flattening, or becoming volatile
Audience quality review: Whether growth appears stable or suspiciously temporary
If you treat follower growth rate as a business metric instead of a vanity metric, Instagram gets much easier to manage.
The Core Formulas for Calculating Follower Growth
The formula should be simple, but it also needs to be technically correct.
A sound instagram follower growth rate calculator uses net follower change over a defined period, not gross follows alone. Social Status defines it this way: ((Followers on the last day of the period − Followers on the first day of the period) / Followers on the first day of the period) × 100. In its example, an account goes from 5,293 followers on March 1 to 5,428 on March 31, a net gain of 135 followers, which equals 2.55% monthly growth, as shown in Social Status's Instagram growth benchmark explanation.

The base formula
Use this structure every time:
Growth Rate = ((Ending Followers − Starting Followers) / Starting Followers) × 100
What each part means:
Starting followers: your follower count at the beginning of the period
Ending followers: your follower count at the end of the period
Net change: ending followers minus starting followers
Growth rate: the net change expressed as a percentage of the starting count
This method matters because it captures gains and losses together. That makes it more useful than a simple “new follows” count.
How to calculate it in practice
You can use the same formula across different reporting windows. The math doesn't change. The period does.
Choose the time frame
Daily works for campaign monitoring. Weekly helps smooth noise. Monthly is usually the cleanest view for benchmarking.Record the starting count
Pull the follower count on the first day of the period.Record the ending count
Use the follower count on the final day of that same period.Subtract to get net new followers
This number may be positive, flat, or negative.Divide by the starting count and multiply by 100
That final percentage is your growth rate.
Don't use gross follows by themselves. If people followed and unfollowed in the same period, gross acquisition can make weak retention look healthy.
Daily, weekly, and monthly use cases
A daily calculation is useful after a giveaway, creator collaboration, or paid push, when you want to see immediate movement.
A weekly calculation helps content teams connect posting patterns with follower response. It's often the most practical window for active testing.
A monthly calculation is the most stable lens for strategy reviews. It reduces daily volatility and gives you a benchmark number you can track over time.
The calculator itself is easy. The value comes from consistent use.
Build Your Own Follower Growth Rate Spreadsheet
A spreadsheet beats most one-off web calculators because it creates history. You don't just get today's answer. You build a record you can compare across weeks, months, content shifts, and campaigns.

Google Sheets works well for this. Excel works too. The important part is keeping the structure clean enough that you'll maintain it.
Set up the sheet
Create these columns in the first row:
Date – Enter the start date or reporting period label (for example: May 1–May 31, 2026). This helps organize and compare performance over time.
Starting Followers – Enter the follower count at the beginning of the reporting period. This serves as your baseline measurement.
Ending Followers – Enter the follower count at the end of the reporting period. This shows where you finished after growth or decline.
Net Change – Calculate the difference between ending followers and starting followers (Ending Followers − Starting Followers). This shows the raw increase or decrease.
Growth Rate – Calculate Net Change ÷ Starting Followers × 100. This converts growth into a percentage for easier comparison across periods.
Notes – Record any important context, such as campaigns, content themes, collaborations, product launches, promotions, or unusual events that may explain changes in performance.
This layout does two jobs at once. It calculates the metric and stores the context that explains it.
Add the formulas
Once the columns are in place, your sheet should calculate automatically.
Use this workflow:
Net Change column: subtract starting followers from ending followers
Growth Rate column: divide net change by starting followers, then format the cell as a percentage
Notes column: log what happened during that period, such as “Reels series,” “UGC push,” or “creator collab.”
That notes column is where the spreadsheet becomes valuable. Without it, you'll know growth changed, but not why.
For a more complete tracking process, this guide on how to track Instagram growth is useful because it helps tie follower movement back to account activity.
Make the spreadsheet usable over time
A lot of teams fail here. They build a perfect file once, then stop updating it.
A workable system is smaller:
Pick one reporting cadence: weekly or monthly
Use the same check-in day: consistency matters more than frequency
Tag unusual periods: giveaways, media mentions, viral posts, or posting gaps
Review trends in batches: a single period rarely tells the full story
A spreadsheet is useful because it stores your decisions beside your numbers. That's what lets you learn from growth instead of just logging it.
Interpreting Your Growth Rate: What's a Good Number?
Many creators ask the wrong version of this question. They ask, “What's a good number?” as if one percentage applies to every account.
Benchmarking guidance suggests that a good monthly Instagram follower growth rate is typically in the 1%–2% range, while some calculators and guides cite 2%–5% per month as solid, depending on platform and industry, according to Hootsuite's Instagram metrics guide. That's useful context, but it's not a verdict.
Use benchmarks as a reference, not a grade
If your account is within or above those ranges, that can indicate healthy momentum. But the bigger question is whether your own trend is improving.
An account with stable, relevant growth often has a stronger foundation than one that jumps around wildly. A temporary spike can come from a giveaway, a broad-reach post, or a low-intent audience burst. That doesn't always turn into durable progress.
Here's a simple framing table you can use without overcomplicating the analysis:
Broad Instagram benchmarks commonly show an average monthly growth rate of around 1%–2%. This is often used as a general baseline for measuring account performance.
A solid performance range cited by some guides and calculators is typically 2%–5% monthly growth, suggesting stronger-than-average account momentum.
Niche-specific accounts can vary significantly because growth depends on factors such as audience behavior, content mix, industry type, and account size.
Campaign-driven periods often produce volatile growth patterns, so results are usually more meaningful when compared against your own historical baseline rather than broad averages.
The comparison that matters most
The common mistake is comparing raw follower gains across accounts with very different sizes. Hootsuite notes that a gain of 100 followers is 10% growth for a 1,000-follower account but only 2% for a 5,000-follower account in the same benchmark discussion. That's why percentage-based analysis is the only fair way to compare growth.
Your strongest benchmark is usually your own historical pattern.
Look at:
Direction: Is growth trending up, flattening, or declining?
Stability: Are gains steady or dependent on isolated spikes?
Context: Did changes follow a content shift, posting gap, campaign, or audience change?
A practical way to judge performance
If I'm reviewing an account, I usually don't label a number “good” or “bad” until I've checked three things:
Whether the trend is improving over multiple periods
Whether engagement stayed healthy during growth
Whether the audience being added matches the account's goals
A growth rate only becomes actionable when you compare it against your own previous periods and the activity that caused the change.
If your rate looks modest but engagement and audience fit are strong, that's often better than fast but unstable growth.
Common Growth Rate Pitfalls and How to Avoid Them
Most calculators stop at net growth. That's a problem.
CommonNinja points out that many follower growth tools explain the percentage formula but don't solve the more practical issue of separating real growth from churn. A calculator that only tracks net follower change can look healthy while hiding a high unfollow rate, as discussed in CommonNinja's follower growth calculator overview.

Net growth can hide bad audience fit
If your account gains followers quickly and loses many of them just as quickly, the top-line percentage can still look acceptable. That often happens after broad-reach content, low-intent giveaways, or inconsistent positioning.
What looks like momentum may be replacement. You're not building audience depth. You're cycling people in and out.
The most common mistakes
Overreacting to short-term swings: Daily movement is noisy. One weak day doesn't mean strategy failure.
Treating spikes as proof of success: A jump after a giveaway or viral post may not produce loyal followers.
Ignoring unfollows: Net growth without churn context can hide retention problems.
Reviewing the number without context: A percentage alone won't tell you which post, message, or campaign caused it.
If follower loss is becoming a pattern, a practical troubleshooting resource is this guide on how to stop losing Instagram followers, especially when you need to diagnose content mismatch or audience fatigue.
How to pressure-test your growth quality
Use a simple audit after any strong growth period:
Content source – Identify which specific posts, campaigns, or collaborations caused the spike in followers or performance change. This helps you understand what actually drives growth so you can repeat or refine it.
Retention – Check whether new followers remain active after the initial spike. This matters because growth without retention often indicates low-quality or mismatched audience acquisition.
Engagement quality – Evaluate whether new followers are actually interacting with your content (likes, comments, saves, shares). This shows whether the growth translated into meaningful attention rather than passive followers.
Audience fit – Assess whether the new followers match your target niche or ideal customer profile. This ensures your growth supports long-term relevance, not just inflated numbers.
Growth that can't hold is usually a targeting problem, a content expectation problem, or both.
A healthy instagram follower growth rate calculator should point you toward sustainability. If it only tells you the percentage and nothing about what happened underneath, it's incomplete.
Actionable Strategies to Improve Your Growth Rate
A better growth rate usually comes from fixing one of three weak points: reach, profile conversion, or retention. The percentage improves fastest when teams stop treating all new followers as equal and start asking a harder question. Are the right people following, staying, and engaging after the first touch?
Porter Metrics explains follower growth through a funnel of visibility, engagement, and conversion in its social media follower growth rate calculator explanation. That framework is useful, but the practical work is in diagnosing which part of the funnel is underperforming.
Improve qualified visibility
More reach helps only if it reaches people who are likely to care about your niche next week, not just today.
Start with content formats that travel well and still match your positioning:
Reels and carousels with clear intent: Use formats that earn shares, saves, and profile visits
Consistent topic signals: Make your niche obvious from the post itself, not just the bio
Relevant collaborations: Partner with creators or brands that attract the audience you want to keep
Theme repetition: Reuse proven angles so Instagram keeps learning who your content is for
If you want outside ideas, this guide on how to grow your social media audience covers organic tactics that are useful for sustainable acquisition.
Raise your profile conversion rate
A lot of accounts blame weak growth on reach when the underlying issue is conversion. The post gets attention. The profile does not close the follow.
Three fixes usually matter most:
Clear content pillars: New visitors should understand your themes in seconds
Immediate value: The first line, first slide, or opening frame should show why the account is worth following
Predictable expectations: The feed should make future value easy to recognize
This operationalizes your growth strategy. Instead of chasing random spikes, you build a profile that turns visits into followers at a higher rate.
For a stronger planning framework, review these Instagram growth strategies and map them against your best-performing posts.
Improve retention, not just acquisition
This is the part many teams miss. If new followers leave within days, your growth rate can look acceptable while audience quality gets worse.
Retention usually improves when content delivery matches the promise that earned the follow. If a giveaway, trend post, or broad-reach Reel brings in people who never wanted your core content, churn rises. The fix is rarely posting more. The fix is publishing more content that attracts your target audience and fewer posts that create weak follow intent.
Use tools to support consistency
Manual tracking works for analysis. Execution is harder when publishing, commenting, and follow-up engagement become inconsistent.
Some teams use support tools alongside spreadsheets and native Instagram analytics. For example, Gainsty is an AI-powered social assistant platform focused on organic Instagram audience growth and engagement support rather than bots or fake followers.
A tool can support consistency. It cannot fix poor audience targeting, unclear positioning, or content that pulls in the wrong followers.
Strong growth comes from attracting people who fit, converting them clearly, and keeping their expectations aligned with what you publish next.
Frequently Asked Questions About Follower Growth
How often should I calculate the follower growth rate?
A creator posts three strong Reels in one week, gains a surge of followers, then watches growth flatten the next week. If they only check monthly, they miss what caused the spike. If they only check daily, they overreact to noise.
Use the cadence that matches the decision. Weekly works well for testing content formats, campaign timing, profile changes, or posting frequency. Monthly is better for evaluating direction because it smooths short-term swings and shows whether growth is holding up.
If you run paid pushes, giveaways, or collaborations, track during the campaign and again after it ends. The second check matters because it shows whether those followers stayed.
Is a high growth rate always good?
No. A high percentage can still come from weak-fit followers who leave fast, ignore your content, or followed for a one-off reason.
Treat growth rate as a starting signal, not a final verdict. Check what happened after the follow. Did engagement hold? Did Story views stay stable? Did saves, shares, or profile visits improve? Did unfollows rise right after a viral post or giveaway?
High growth with high churn usually points to an audience quality problem. Slower growth with solid engagement and retention is often healthier and easier to build on.
My growth rate is negative. What should I do first
Start with the last 30 to 60 days and look for the break point. Negative growth rarely appears without context.
Check these areas first:
Recent content changes: Did your topics, format, or tone shift away from what people originally followed for?
Acquisition source quality: Did a giveaway, trend, or broad-reach Reel attract people who were unlikely to stay?
Profile alignment: Does your bio, pinned content, and recent grid clearly match the audience you want?
Posting consistency: Long gaps or erratic publishing often lead to follower loss.
Engagement trend: If reach stayed high but saves, shares, comments, or Story replies dropped, the content may be attracting attention without building loyalty.
Negative growth does not always mean the account is failing. It usually means acquisition and retention are out of sync, and that can be fixed.
If you use Gainsty in your workflow, treat it as support for execution and tracking, not a substitute for audience fit. The useful habit is simple. Measure growth, check whether those followers stay and engage, then adjust content based on that pattern.