Beyond the Follower Count: Why True Growth Tracking Matters
A lot of Instagram advice stops at “open Insights and check followers.” That's useful, but it's incomplete. The hard part isn't finding the number. The hard part is turning that number into something meaningful.
Instagram's own help documentation explains that Insights is available for professional accounts and shows account data within a limited in-app view, including the past 30 days on mobile, which creates a real gap for anyone trying to build a consistent long-term benchmark across accounts or reporting periods through Instagram Insights for professional accounts.
That gap matters because follower totals are snapshots. Growth tracking is a pattern.
If you only check the current follower count, you can't answer the questions that matter in a business setting:
Was growth steady or uneven?
Did a campaign create lasting gains or just a temporary bump?
Are you attracting the right audience or low-quality followers?
Did posting changes improve account health or just increase noise?
Follower count is a vanity metric when it stands alone. Growth rate becomes a business metric because it shows pace, direction, and comparability.
I've seen teams celebrate a higher follower total even when the account was underperforming. The issue wasn't bad content reporting. It was a bad measurement. They were looking at the endpoint, not the movement.
A better process starts with a simple rule. Always track follower change over a fixed period, and always compare like with like. Month against month works well because it lines up with how most reporting cycles already run. Once that baseline is in place, you can connect growth to content, posting cadence, and audience response instead of guessing.
Identifying Your Core Growth Metrics
A usable Instagram growth report starts with restraint. If the metric set gets too wide, teams spend time collecting numbers they never use. I keep the core view tight so each metric answers a specific question about audience quality, content performance, or account momentum.

Start with net growth and growth rate
Track net follower growth first. This is the raw change in followers across a fixed reporting period. It shows whether the audience grew, shrank, or stalled.
Then track follower growth rate. I treat this as the metric that makes follower reporting useful, because it puts movement in proportion to account size. A gain of 500 followers means very different things on a 5,000-follower account and a 500,000-follower account.
Growth rate formula: “(Followers on last day of month – Followers on first day of month) divided by Followers on first day of month,” then multiplied by 100.
That formula is simple, but it changes the quality of the analysis. It helps compare months fairly, compare accounts with very different audiences, and keep follower totals from becoming a vanity report. If you want a refresher on where Instagram surfaces the raw inputs, this breakdown of Instagram Insights metrics and reporting views is a useful reference.
Track losses, not just gains
Raw follower adds are incomplete. Unfollows matter just as much because they show whether growth is holding or leaking.
I review follow gains and follower losses in the same reporting window every time. A Reel can create a sharp spike in follows and still be a weak acquisition asset if those new followers leave within days. In practice, that pattern usually points to one of three issues: the content overpromised, the account did not deliver a consistent follow-up experience, or the audience was broad but poorly matched.
This is one of the clearest trade-offs in Instagram reporting. Fast follower acquisition can look good in a monthly summary, but retention usually tells you more about content fit.
Add audience fit and supporting metrics
Follower growth matters only if the people arriving are relevant to the brand, offer, or content category. That makes demographics, reach, engagement, and profile activity the context metrics that explain whether growth is healthy.
Here is the core stack I use:
Follower count: Shows your current audience size and overall scale of your account.
Net growth: Shows whether your audience is increasing or decreasing over a given period.
Growth rate: Shows how fast your account is growing relative to its current size, making it easier to compare performance over time.
Unfollows: Indicates possible issues like content mismatch, audience fatigue, or changes in relevance.
Demographics: Shows whether the people following you match your intended target audience.
Reach and engagement: Shows whether your content is being seen widely and whether people are actually responding to it.
I do not treat every metric equally. Growth rate and unfollows help measure audience momentum. Demographics help validate audience fit. Reach, engagement, and profile activity help explain why the change happened. If engagement analysis is part of your reporting workflow, this guide to Instagram engagement for creators pairs well with follower tracking because it helps connect audience growth to content response instead of reporting those numbers in isolation.
Using Instagram Insights for Basic Follower Tracking
Instagram Insights is still the first place to start. It's free, native, and fast enough for routine checks. For solo creators and small brands, that's often enough to establish a basic reporting habit before adding spreadsheets or external platforms.

Where to find the data
On a professional Instagram account, go into the app, open your profile, and enter Insights. From there, look at audience and account-level performance areas that show follower movement and supporting activity.
What I pay attention to inside the app is usually simple:
Current follower total for the present snapshot.
Follows and unfollows within the available reporting window.
Reach and engagement during the same period.
Recent posts and Reels that line up with visible spikes or dips.
That last point matters more than is commonly understood. You're not just trying to record growth. You're trying to explain it.
What Instagram Insights does well
Insights are good for quick operational checks. If you posted a Reel yesterday and want to know whether it coincided with a noticeable lift in follows, the native app can give you a near-term answer. It also keeps the data close to the content, which makes it easier for creators who don't want a separate analytics workflow.
For many accounts, it's the easiest place to start building discipline around regular reporting.
If you want a plain-English breakdown of what the app's metrics mean before you build your own reporting layer, Clepher's piece on interpreting Instagram data is a useful companion read.
Where the native tool starts to break down
The limitation is workflow, not access. Sotrender notes that follower growth is measured “day by day, over a particular period,” and also points out that Instagram Insights is mobile-only, which makes desktop tracking impossible inside Instagram itself. That's one reason external tools became popular for selectable date ranges and longer trend analysis, as covered in this overview of Instagram follower growth tracking.
Once you're trying to report across campaigns, compare multiple months, or share clean summaries with a team, the app gets cramped.
The common friction points are practical:
Mobile-only access slows down reporting.
Shorter native windows make historical analysis harder.
No clean spreadsheet workflow means more manual copying.
Cross-account comparisons are awkward if you manage several profiles.
For a more detailed walkthrough of the app's reporting views before you move into a custom system, Gainsty's article on Instagram Insights is helpful.
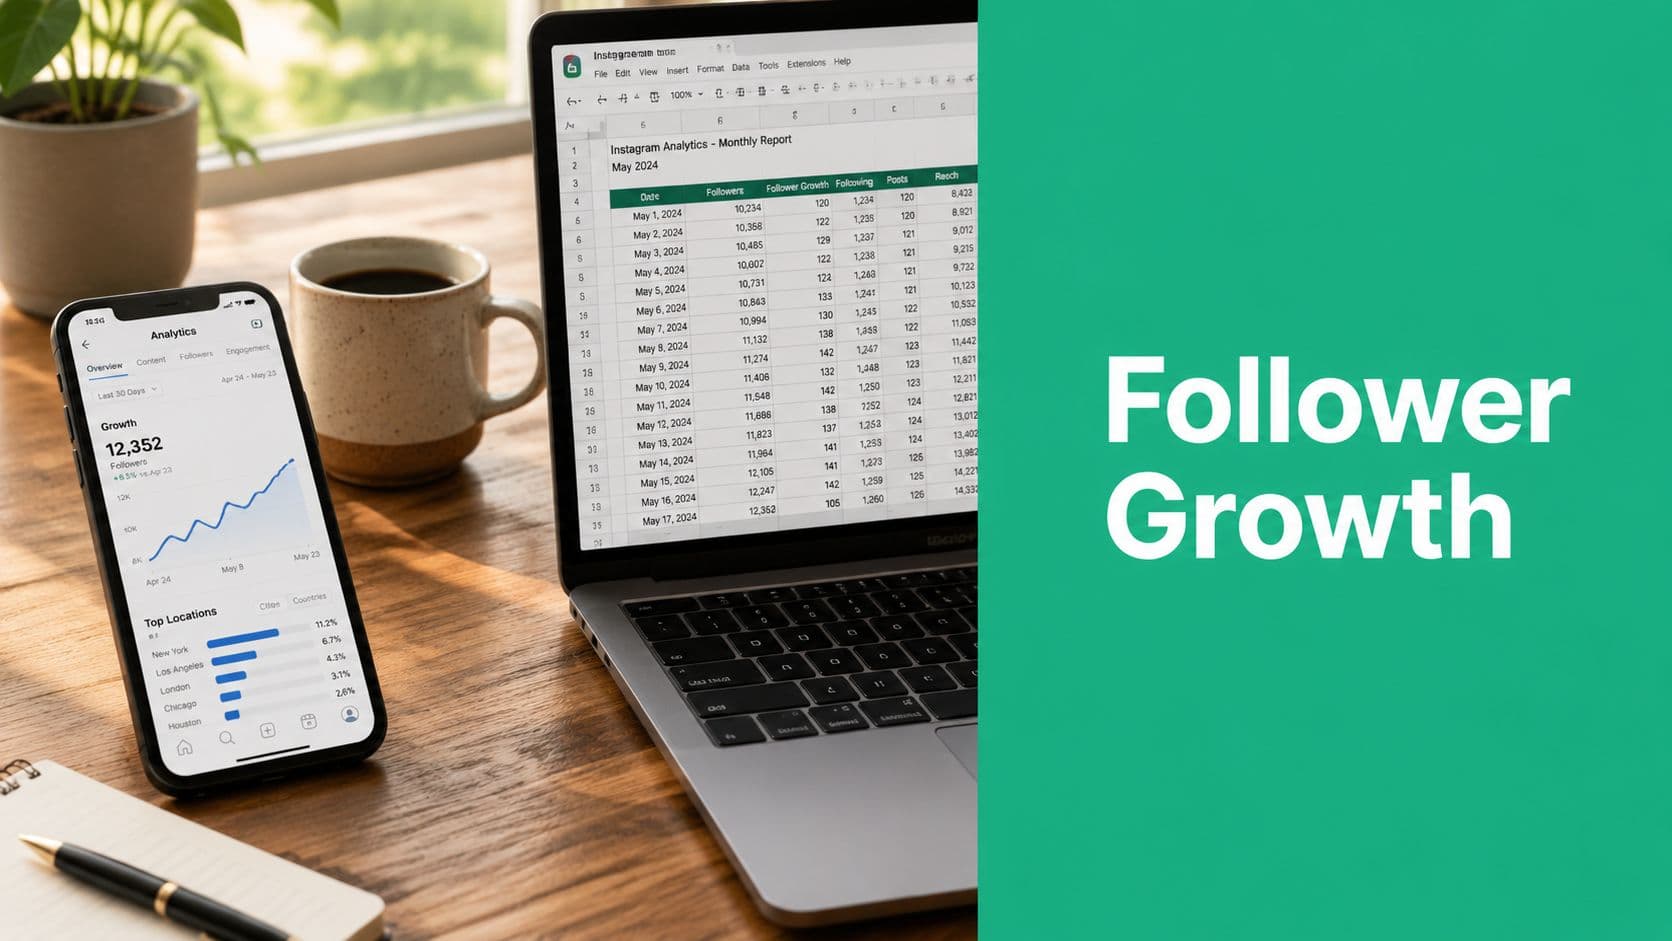
Calculating Growth Rates and Trends with Spreadsheets
A follower count on its own is a vanity snapshot. The useful number is how fast the account is growing, over a fixed period, relative to its starting size. That is the metric I put in reports, because it lets teams compare months fairly instead of celebrating raw gains that may just reflect a larger base.
A spreadsheet is still the simplest way to do that well. It gives you a historical record, clear calculation rules, and enough context to explain why growth changed. It also makes weak reporting habits obvious. If dates are inconsistent or notes are missing, the trend line stops being trustworthy.
The simplest sheet that works
Use Google Sheets or Excel and create columns like these:
Date: The time period you are measuring (e.g., a day, week, or month).
Starting Followers: The number of followers you had at the beginning of the period.
Ending Followers: The number of followers you had at the end of the period.
Net Change: The difference between ending followers and starting followers (growth or loss).
Growth Rate: The percentage change in followers relative to your starting number.
Notes: Context behind the numbers, such as campaigns, content themes, collaborations, or unusual events that may have influenced performance.
Keep the setup plain. The value comes from consistency, not formatting.
The Notes column does more work than the math for a lot of accounts. Log campaign launches, collaboration posts, Reel spikes, giveaway periods, posting gaps, and any change in publishing cadence. Six weeks later, that context is usually the difference between a useful report and a guess.
I prefer one row per reporting period, not one row every time someone checks the app. Monthly is the easiest starting point because it keeps the process manageable and makes month-over-month comparisons clean. If you run fast campaigns or creator partnerships, weekly tracking can make sense, but only if someone will maintain it without fail.
Use a fixed formula every time
The monthly calculation is simple:
Growth Rate = ((Ending Followers - Starting Followers) / Starting Followers) x 100
In a spreadsheet, that means you subtract the starting count from the ending count, divide by the starting count, and format the result as a percentage.
Practical rule: Use the same start day, end day, and formula every period. If the measurement window shifts, your trend line loses comparability.
That percentage is what turns follower tracking into performance analysis. Gaining 500 followers means one thing on a 5,000-follower account and something very different on a 100,000-follower account. Growth rate gives both numbers proper context.
Interpret the result like an operator
To interpret the result correctly, use it as a reference point, not a verdict.
A strong month for a creator pushing highly shareable Reels will not look the same as a stable month for a brand in a narrow B2B niche. Seasonality matters. Paid support matters. Posting volume matters. The job is not to force every account toward the same percentage. The job is to track whether growth is improving, flattening, or becoming erratic, then tie that shift back to actual activity.
That is why I always review growth rate besides publishing notes and campaign timing. If the rate jumps after a collaboration series, that is useful. If it drops during a month with fewer posts, that is also useful. The number matters because it points to decisions.
Build trend analysis into the sheet
After three to six reporting periods, patterns start to show up clearly. At that point, the spreadsheet becomes a decision tool, not just a log.
Look for trends like:
Steady improvement after a repeatable content format starts working
Short spikes tied to a specific Reel, collaboration, or giveaway
Flat periods during inconsistent posting or weak creative batches
Negative periods after audience mismatch, low-quality traffic, or long inactivity
I also keep a second tab for content context. It does not need every post. It should capture major campaigns, standout assets, posting frequency, and any distribution support, such as paid boosts or creator partnerships. That extra tab makes review meetings faster because the team can connect movement in follower growth to what was published.
If you want to sanity-check your formula before rolling it into a recurring template, Gainsty's Instagram follower growth rate calculator is a practical cross-check.
What works and what fails
What works is boring. Same reporting cadence. Same formula. Same definitions. Over time, that discipline gives you trend data you can trust.
What fails is random spot-checking, screenshots from different dates, and retroactive storytelling. That method produces activity logs, not analysis. A spreadsheet takes more effort, but it gives you an audit trail, and that is what turns follower growth from a vanity metric into a business metric.
Advanced Tracking with Analytics Tools
Spreadsheets are reliable, but they cost time. Once you're managing several accounts, sending recurring reports, or trying to analyze trends without a lot of manual entry, analytics tools start to earn their place.
The main value isn't that they replace thinking. It's that they reduce admin work and preserve historical visibility.
Manual tracking versus tool-based tracking
Here's the practical difference:
Native Instagram Insights:
Strength: Fast, free, and easy for quick performance checks directly inside the app.
Trade-off: Limited depth and flexibility, with fewer options for custom reporting or long-term workflow tracking.
Spreadsheet tracking:
Strength: Highly flexible, transparent, and fully customizable to your specific metrics and goals.
Trade-off: Requires manual updates, which can be time-consuming and prone to inconsistency.
Analytics platforms:
Strength: Provide historical data, streamlined reporting, and more advanced dashboards for clearer insights.
Trade-off: Comes with additional cost and requires choosing and managing an extra tool in your workflow.
A dedicated platform is usually worth it when one of three things happens. You need longer-range trend data, you need stakeholder-ready reporting, or you need to compare performance across multiple profiles without copy-pasting from a phone.

What to look for in a tool
I don't choose analytics software based on how many charts it offers. I choose it based on whether it answers operating questions quickly.
A strong tool should help you:
See follower movement over time without rebuilding date ranges manually
Compare periods cleanly so the month-over-month review is simple
Connect performance to content activity rather than leaving growth isolated
Export or share reports without reformatting everything yourself
That's the line between dashboards that look impressive and dashboards that help a team decide what to do next.
Where a platform fits into the workflow
For example, Gainsty includes analytics inside its broader Instagram growth platform, which can be useful if you want follower tracking and growth activity in one environment rather than splitting reporting across separate tools. That's one option among several categories of software covered in this roundup of Instagram analytics tools.
The important point isn't the brand name. It's the workflow design.
If your team still needs a spreadsheet to explain what the platform dashboard means, the tool isn't reducing much friction. If the platform gives you a clear view of trend direction, content correlation, and organic audience movement, then it's doing its job.
Tools should shorten the distance between “what happened?” and “what should we change?”
That's the key upgrade from manual tracking. Not more data. Faster decisions with clearer evidence.
Turning Follower Data into Actionable Strategy
The best follower report answers a content question.
If growth spikes, you want to know what caused it and whether it can be repeated. If growth stalls, you want to know whether the issue is reach, content resonance, audience quality, or publishing consistency. If unfollows climb, you want to know what changed before the drop.

Diagnose spikes, dips, and flat periods
When I review a growth chart, I look at it like a timeline, not a scorecard.
A spike usually deserves a content audit. Check which post, Reel, collaboration, mention, or campaign was live at that point.
A plateau usually points to a consistency or format issue. The account may be publishing, but not in a way that expands reach.
A drop needs closer inspection. Look at recent content themes, posting gaps, and whether the audience being attracted is aligned with the account.
This is also where follower quality matters. Improvado recommends combining follower trend tracking with audience-quality diagnostics by checking Instagram Insights for reach and engagement, then auditing the last 20 followers daily for bot indicators such as no profile photo, no posts, or following large numbers of accounts. It also notes that if more than 30% of that sample lacks basic authenticity signals, the account has quality issues, and suggests a content benchmark of 3 Reels and 2 carousels per week. The same guide says Reels can deliver 1.5x more reach than static posts for accounts under 10K followers in its article on Instagram growth strategies.
Turn analysis into content decisions
That data should change what you publish.
If Reels drive the strongest follower movement, invest in a repeatable Reel format. If carousels bring profile visits from a relevant audience, keep them in rotation. If a certain topic produces weak engagement and a rise in low-quality followers, cut it.
For creators refining short-form storytelling, this guide on how to craft multi-shot Reels narratives is useful because it focuses on structure, not just editing tricks.
Track growth to make better content decisions, not to admire charts.
A good reporting rhythm closes the loop. You publish, measure, diagnose, adjust, and repeat. That's how follower data turns into strategy instead of sitting in a dashboard as an afterthought.
If you want a cleaner way to monitor Instagram growth alongside your broader organic efforts, Gainsty is worth exploring. It combines growth support with analytics so you can watch follower movement, review performance trends, and connect account activity to measurable outcomes without relying only on manual checks inside the Instagram app.