Why Content Performance Metrics Matter

Putting content out into the world without tracking its performance is a bit like shooting arrows in the dark. You’re doing something, but you have no idea if you're hitting the target or just wasting your arrows. Content performance metrics are the lights that illuminate the target, giving you the feedback you need to aim better next time.
Every blog post you write, video you produce, or social media update you share is a mini-experiment. Your metrics are the results. They show you who is paying attention, what they find interesting, and whether your message is connecting. Without this data, you're just making educated guesses.
From Guesswork to Evidence-Based Strategy
Relying on a "gut feeling" to steer your content strategy is a surefire way to burn through your time and budget. When you start tracking performance, you shift from making subjective guesses to making objective, data-backed decisions. This isn't just a "nice-to-have"; it’s essential for a few key reasons:
Justifying Efforts and Budgets: It’s much easier to get buy-in for your content budget when you can point to a specific article and show how it directly led to a spike in traffic, generated X number of leads, or contributed to sales.
Understanding Your Audience: Your Metrics Tell a Story. A high bounce rate might mean your headline wrote a check that your content couldn't cash. On the flip side, a long time on page is a clear signal that you’ve found a topic your audience is genuinely hungry for.
Optimizing Future Content: Once you see which content formats, topics, or promotion channels get the best results, you know exactly where to focus your energy. You can double down on what’s proven to work and stop pouring resources into things that don’t.
> The real magic of content performance metrics isn’t just in the numbers themselves, but in the story they tell. Each data point is a clue, helping you connect your content directly to your business goals.
Of course, just having the data isn't enough. Knowing how to analyze content performance is what turns those raw numbers into insights that help you grow. This guide will walk you through the key metrics you should be watching, so you can move beyond simple data collection and start making smarter, strategic decisions for your entire content program.
Measuring Your Content's Initial Reach
So, you’ve hit "publish." Now what? The very first question every content creator asks is a simple one: Is anyone seeing this? This is where your reach and awareness metrics come into play.
Think of these numbers as the digital equivalent of foot traffic. If your website is a store, reach metrics tell you how many people are walking past your front door and peeking inside. They're your first clue as to whether your promotional efforts—be it social media, SEO, or email—are working. A big spike tells you something went right, while a trickle of visitors might mean it’s time to rethink your strategy.
This is the foundational layer of understanding your content's journey, as you can see here.
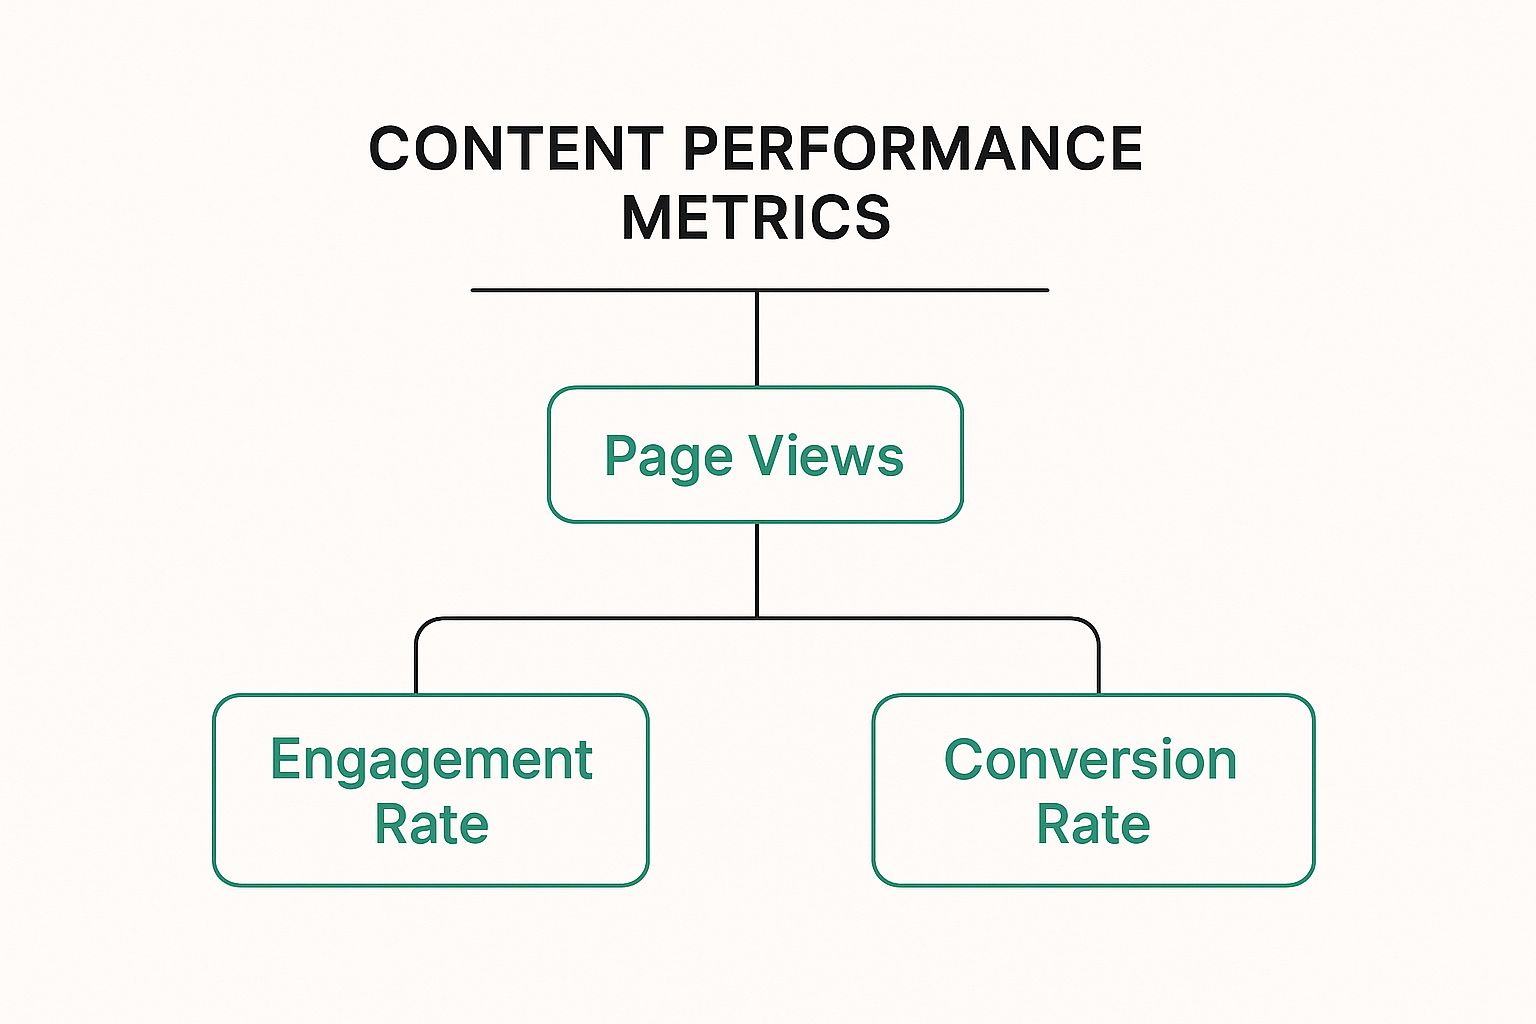
As the pyramid shows, you can't get to the juicy stuff like engagement and conversions until people see your content in the first place. It all starts with Page Views and broad visibility.
Getting a Grip on Core Reach Metrics
To really understand your initial audience, you need to look at a handful of key indicators. Each one tells a slightly different story, but together they paint a clear picture of how visible your content truly is.
Here's a quick-reference list to break down the most common top-funnel metrics you'll encounter.
Impressions measure how many times your content was displayed on a screen. This metric is primarily used to gauge the total exposure of an ad or a social media post.
Page Views track the total number of times a specific page was loaded. It's useful for understanding the popularity and overall traffic to a piece of content.
Unique Visitors represent the number of distinct individuals who visited your site, helping you understand the actual size of your audience by filtering out repeat visits.
These metrics work together to give you context. A high number of impressions but low page views might mean your headline isn't compelling, while a high number of page views from a small group of unique visitors indicates a loyal, returning audience.
> An easy way to think about it: Impressions are how many people saw your store's sign. Page Views are how many times the front door opened. Unique Visitors tell you how many different shoppers walked inside.
Why Your Traffic Sources Matter
Knowing how many people see your content is only half the story. The other, arguably more important, half is knowing where they came from. Analyzing your traffic sources is like being a detective for your marketing. It tells you which channels are working hard for you and which ones are slacking off.
Your traffic will generally be sorted into these buckets:
Organic Search: People who found you by typing a query into a search engine like Google. This is a direct reflection of your SEO success.
Social Media: Visitors who clicked through from platforms like Instagram, Facebook, LinkedIn, or X. This tells you how effective your social content and promotion are.
Referral: Clicks from links on other websites. This is gold for measuring the impact of your PR, guest posting, and backlinking efforts.
Direct: Folks who typed your URL straight into their browser or used a bookmark. These are often your most loyal followers and brand evangelists.
By digging into these sources, you can uncover powerful insights. Maybe you’ll find that your in-depth blog posts get tons of traffic from organic search, while your infographics are a massive hit on social media. Understanding the nuances of your Instagram performance metrics, for example, can reveal what kind of visual content drives the most reach on that specific platform.
This level of detail is where real strategy is born. It allows you to stop guessing and start investing your time and money into the channels that deliver real, measurable results.
Gauging Audience Interest and Engagement

Getting people to your website is one thing, but are they sticking around to read what you've written? This is where the real story begins. We need to move beyond just counting visitors and start looking at engagement—the metrics that tell you if your content is truly hitting the mark or just getting a passing glance.
Think of it like this: your reach is how many people walk into your store. Your engagement is how many of those people stop, browse the aisles, and interact with your products. It’s the difference between a window shopper and a genuinely interested customer.
The Power of Time on Page
One of the most revealing metrics in your toolkit is Time on Page. Sometimes called Dwell Time, this metric tells you exactly how long someone spends on a specific page. It’s a powerful signal because it goes beyond a simple click to show how deeply a person is connecting with your content.
Simply put, more time usually means more interest. When someone spends five minutes reading your 2,000-word guide, they're sending a clear message to you (and to search engines) that your content is valuable and relevant. This is far more meaningful than a visitor who lands and leaves in seconds.
Decoding the Bounce Rate
For years, Bounce Rate has been the metric that sends marketers into a panic. A "bounce" is when someone visits a single page on your site and then leaves without clicking anywhere else. But a high bounce rate isn't automatically a disaster. Context is everything.
Imagine these two scenarios:
A "Bad" Bounce: Someone lands on your homepage from a search, finds it confusing, and immediately hits the back button. That’s a clear sign of a problem.
A "Good" Bounce: Someone searches "how to change a tire," lands on your step-by-step guide, gets the exact info they need, and leaves. Your content did its job perfectly, even though they bounced.
> A high bounce rate isn't a failure; it's a question. It forces you to ask why people are leaving. Did they get what they came for, or were they just disappointed?
To get the real story, look at Bounce Rate alongside Time on Page. A high bounce rate combined with a very low Time on Page (under 10 seconds) is a definite red flag. But a high bounce rate with a solid Time on Page (say, 3+ minutes) could mean your content was so helpful the user didn't need to go anywhere else.
Beyond Clicks: Social Signals and Scroll Depth
Your analytics platform gives you the numbers, but your audience's direct actions—their social signals—give you the human side of the story.
Keep an eye on these key indicators:
Comments: A direct pipeline into your audience's thoughts and questions.
Shares: The ultimate compliment—when someone puts their reputation on the line to recommend your content.
Likes/Reactions: A quick, at-a-glance measure of your content's immediate appeal.
Another hugely important, yet often ignored, metric is Scroll Depth. This tells you how far down the page people are reading. It doesn't matter how brilliant your final point is if 90% of your visitors never scroll far enough to see it. Tools within Gainsty and other platforms can track this, pinpointing the exact spot where readers lose interest so you can fix it.
You can even get more granular and measure the quality of specific content, such as newsletters, to understand what resonates. By weaving all these engagement metrics together, you can build a complete, nuanced picture of what truly captures and holds your audience's attention.
Connecting Content to Real Business Results
While metrics like reach and engagement are great for gauging if people like your content, they don't tell you if it's making you money. This next set of metrics is where the rubber meets the road. It's how you shift your content from a "cost center" to a "revenue driver" in the eyes of your company's leadership.
These are the numbers that get the attention of executives and prove the undeniable dollar value of your work. They connect your blog posts, videos, and guides directly to tangible business outcomes, answering the ultimate question: is our content helping us grow?
The Ultimate Test: Conversion Rate
At the end of the day, Conversion Rate is the ultimate measure of your content's persuasive power. It’s simply the percentage of people who take a specific action you want them to take after consuming a piece of content. That action doesn't have to be a purchase—it can be any step that moves someone closer to becoming a customer.
Think of it as the moment of truth. After reading your compelling article, did someone feel inspired enough to act? This is how you find out.
What counts as a conversion? That’s entirely up to you and your goals. It could be:
Newsletter Sign-ups: A reader gives you their email to get more content.
Demo Requests: A potential customer wants to see your product in action after reading a case study.
Ebook Downloads: A user trades their contact information for an in-depth guide.
Free Trial Starts: A visitor decides to try your service after watching a tutorial.
By setting up these goals in your analytics tools, you can tie these valuable actions directly back to the content that sparked them. This data is pure gold, showing you exactly which topics and formats are motivating your audience to take the next step.
From Readers to Leads: Uncovering Lead Generation
Where conversion rate tracks a specific action, Lead Generation measures the total number of new potential customers your content brings in. A "lead" is simply anyone who has shown interest in what you offer by giving you their contact information. Every newsletter subscriber or ebook downloader is a fresh lead for your sales and marketing teams to work with.
Tracking which articles or webinars generate the most leads helps you zero in on what truly resonates with your ideal customer. For example, if you see that a post about "Advanced Instagram Ad Strategies" brings in 50 new leads every single month, that’s a flashing neon sign telling you to create more content just like it.
> The most effective content doesn't just inform; it creates opportunities. By measuring lead generation, you can pinpoint the exact pieces of content that are actively filling your sales pipeline.
The Hidden Influence of Content-Assisted Conversions
Here’s a story you’ve probably lived: someone reads your fantastic blog post, leaves your site, then comes back a week later through a Google Ad to make a purchase. Under a basic "last-click" attribution model, the ad gets 100% of the credit. But was that the whole story? Not even close.
Your content played a crucial, behind-the-scenes role in that decision. This is where Content-Assisted Conversions come into play. This metric shows you how many sales your content helped with, even if it wasn't the very last thing a customer saw before buying. It recognizes that the customer journey is rarely a straight line.
Your blog post might have been the perfect "assist" that set up the final "goal." Understanding this helps you see the true, often hidden, value of your top-of-funnel content—the stuff designed to educate and build trust. It proves that even content without a direct sales pitch can have a massive financial impact down the line.
Just as a great content plan is key to measuring social media success by influencing future actions, tracking these assists ensures you don't accidentally kill a valuable, awareness-building part of your strategy.
Building Authority and Long-Term Loyalty

A single conversion is a transaction. But if you want to build a real brand, you need more than that. The best content doesn't just convince someone to buy once; it transforms them into a loyal follower. This is where we pivot from chasing short-term wins to building a long-term, sustainable strategy. It's all about tracking the metrics that prove you’re creating an audience that genuinely trusts you.
These are the numbers that show you're fostering a real community, not just collecting drive-by traffic. They prove your content is establishing your brand as a go-to authority in your space—a voice people actively seek out, again and again.
Cultivating a Loyal Community
One of the best ways to see if you're building something that lasts is to look at your ratio of New vs. Returning Visitors. Of course, new visitors are great for growth. But a healthy stream of returning visitors is a clear signal that your content is valuable enough to bring people back. It’s the difference between a one-hit wonder and a classic album.
You can also see your community growing through a few other key actions:
Subscriber Growth: Whether it's your email newsletter or social media channels, a climbing subscriber count is a direct vote of confidence. It says people want to hear what you have to say next.
Direct Traffic Increases: When people start typing your URL straight into their browser, you know you've made an impression. This signals strong brand recall and a dedicated following.
These indicators are crucial because they show your content is shifting from being just an information source to a trusted resource. If you want a deeper look at proving the value of these efforts, check out our guide on calculating your social media ROI.
Earning Credibility with SEO Signals
Google and other search engines are incredibly good at identifying genuine authority. They look for specific clues that show your content is trustworthy and respected by others. Two of the most powerful metrics for this are Backlinks and Domain Authority.
A backlink is a stamp of approval from another website. When a reputable site links to your content, they're putting their credibility on the line to vouch for yours.
> Think of high-quality backlinks as expert endorsements. The more credible endorsements you collect, the more search engines see you as an authority. This leads directly to better rankings and more organic traffic.
Domain Authority (DA), a score developed by Moz, predicts how well your website will rank in search results. It’s based on factors like the quantity and quality of backlinks pointing to your site. A higher DA score signals greater authority, which helps all your content rank better.
Using Historical Data to Predict the Future
Ultimately, the goal of tracking these metrics is to build a content machine that delivers predictable results. This is where analyzing historical performance data becomes your secret weapon. By understanding past trends, you can stop reacting to your results and start proactively shaping them.
This is especially vital for businesses built on long-term relationships. For SaaS companies, historical data on customer acquisition, churn, and customer lifetime value (CLV) is the bedrock of strategic planning. A McKinsey study found that companies that consistently use historical data in their decision-making are 23% more likely to achieve superior revenue growth and profitability.
Analyzing past behavior helps you spot the early warning signs of churn, giving you a chance to step in with retention strategies before it’s too late. By keeping a close eye on these long-term metrics, you can forecast growth, pinpoint your most valuable content, and build a brand that people don't just find—they trust and follow it.
Your Questions About Content Metrics Answered
Diving into analytics can feel like trying to drink from a firehose. You’re staring at a wall of numbers, but which ones tell you if your content is working? Let’s cut through the noise and tackle the most common questions about content performance metrics, turning that data overload into clear, confident decisions.
Think of this as your go-to field guide. We'll sort out the confusing parts that trip up even seasoned marketers, so you can start putting this knowledge to work right away.
Which Metrics Should I Track First?
This is the big one, and the honest answer is: it depends entirely on what you want that piece of content to accomplish. There’s no magic, one-size-fits-all metric. You have to match your metrics to your mission.
It’s like being a chef. You wouldn't use the same tools to bake a delicate soufflé as you would to grill a steak. The same logic applies to your content.
Goal: Boost Brand Awareness? Focus on reach. You'll want to watch numbers like Page Views, Impressions, and Unique Visitors. The name of the game is getting as many eyeballs as possible on your brand.
Goal: Improve Content Quality? This calls for engagement metrics. Keep an eye on Time on Page, Scroll Depth, and Comments. These tell you if people are truly sticking around and connecting with what you've created.
Goal: Generate Leads? Now we're talking about conversions. Your most important numbers will be things like Conversion Rate for specific actions, like someone downloading an ebook or signing up for a demo.
> Here's a pro tip: don't try to track everything at once. Pick the one main goal for a piece of content, then choose one or two key metrics that directly measure it. This focus makes your analysis cleaner and far more powerful.
How Do I Know If My Numbers Are Good?
"Good" is always relative. A great "Time on Page" for a quick 500-word blog post would be terrible for an in-depth, 3,000-word guide. The real key is to stop chasing vague industry averages and start creating your benchmarks.
Begin by looking at your history. What’s the average Time on Page for all your blog posts from the last six months? That number is now your baseline. Any new article that smashes that average is a certified winner.
Another fantastic approach is to pit your content against itself. If one article has double the conversion rate of another on a similar topic, it's time to play detective. Was the call-to-action clearer? Was the formatting more scannable? This internal competition is one of the best ways to drive improvement across the board.
How Often Should I Check My Metrics?
Obsessively checking your metrics every day can be just as useless as never checking them at all. You get caught up in tiny, meaningless daily blips and completely lose sight of the bigger picture.
Instead, find a rhythm that works. Here’s a practical schedule to get you started:
1. Weekly Check-in: A quick, 15-minute glance at your top-level numbers. Are there any huge, unexpected spikes or drops in traffic? This is purely for spotting problems, not for deep analysis.
2. Monthly Review: This is where you roll up your sleeves. Analyze the performance of everything you published that month. Compare it against previous months to spot trends. Are your engagement rates slowly climbing? Are you on track to hit your lead goals?
3. Quarterly Strategy Session: Time to zoom out. Look at your entire content program over the last 90 days. What were your biggest home runs and your biggest flops? Use these insights to map out your content plan for the next quarter.
This cadence keeps you from overreacting to daily noise while ensuring you’re making smart, data-informed adjustments. To get a better handle on which numbers are truly vital, you can explore some key Google Analytics metrics that are essential for measuring performance.
Ready to stop guessing and start growing? Gainsty uses advanced AI and expert strategy to drive real, organic follower growth and engagement on your Instagram. See how we can help you go viral. Get started with Gainsty today!

.png&w=1920&q=75&dpl=dpl_5vvnEneLD2DAfKTSR86kjNKSWjSC)


.png&w=750&q=75&dpl=dpl_5vvnEneLD2DAfKTSR86kjNKSWjSC)