Why Your Engagement Rate Matters More Than Follower Count
A profile with 100,000 followers can still underperform if posts rarely get comments, saves, shares, or story replies. A smaller account with steady interaction is often in a better position to grow, sell, and maintain reach.
Follower count is a snapshot. Engagement rate is a live signal. It shows whether people respond when content goes live, which makes it more useful for day-to-day decisions.

What the metric tells you
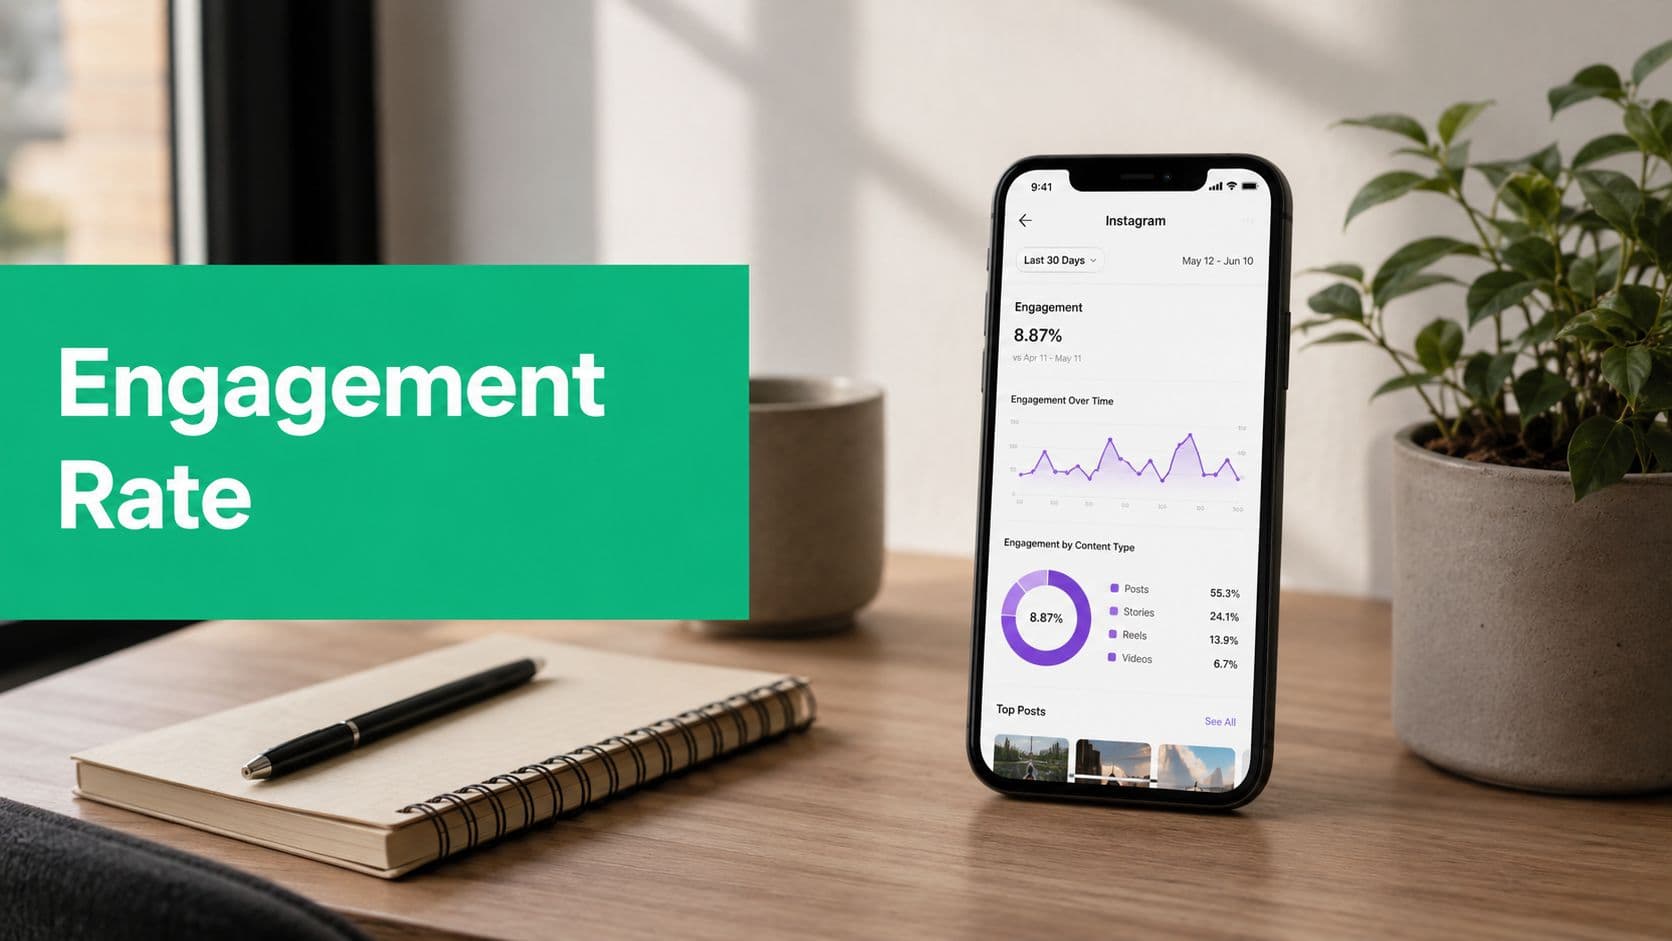
At its simplest, engagement rate measures the share of your audience that interacts with your content. A common starting formula is (Total Engagements ÷ Total Followers) × 100, and total engagements usually includes likes, comments, saves, and shares, as noted in Sprout Social's Instagram engagement rate guide.
But the formula only matters if it fits the question.
If the goal is community health, a follower-based rate works well because it shows how responsive your audience is. If the goal is viral potential or distribution, follower count matters less because a Reel can perform far beyond your existing audience. If the goal is content quality, saves and shares usually matter more than likes because they signal utility, not quick approval.
That is why a single engagement rate can mislead teams when they use it for every report. The metric is useful. Context decides whether it clarifies or confuses.
If you need cleaner reporting from Instagram's native data, this guide to reading Instagram Insights metrics the right way helps connect engagement numbers to reach, impressions, and content format.
Practical rule: Match the formula to the decision. Use follower-based engagement rate to judge audience health. Use content-level engagement signals to judge whether a specific post earned attention.
Why this matters for growth
In most account audits, the issue is not that everything performs poorly. It is uneven performance across formats and topics. Carousels may drive saves. Reels may get reach but weak interaction. Stories may pull replies from loyal followers even when feed posts look average.
That is why follower count can point teams in the wrong direction. It can rise while audience quality drops. It can look impressive while engagement is concentrated in one format. It can also hide retention problems, especially after giveaways, low-intent growth tactics, or broad collaborations that attract the wrong audience.
A common benchmark for Instagram engagement rate is 1% to 5%, with variation by niche, audience size, and content type, as noted earlier. Use that as a rough reference, not a goal by itself.
Use engagement rate to answer questions like these:
Is your audience still responsive? Low engagement from a large follower base often points to weak audience fit or stale content habits.
Which content earns stronger intent? Saves and shares usually tell you more about long-term value than likes.
Are you growing with the right people? Follower growth with falling engagement often means your audience is getting broader but less aligned.
Which formula should you use? Follower-based rate helps with community health. Post-level or reach-based analysis is better for judging content performance outside your existing audience.
For organic growth, engagement rate is more useful than follower count because it tells you what to improve.
Calculating Your Core Instagram Engagement Rate
A useful engagement rate starts with the question behind it. Are you checking whether your current audience still cares, or comparing posts to see what deserves another round? Use one formula for account health and another for content review.
Use the follower-based formula for account health
The standard account-level formula is:
Formula: (Total Engagements ÷ Total Followers) × 100
Ideally, total engagements should include likes, comments, saves, and shares. If you leave out saves and shares, the number gets easier to calculate but less useful. Those actions often show stronger intent than a quick like.
Use this version when you want a steady read on community health. It works well for weekly reporting, creator vetting, and public account comparisons where reach data is unavailable. It is less useful for judging breakout content because follower count says nothing about how many people saw the post.
Benchmarks vary by niche, account size, and content mix, as noted earlier. Treat them as context, not a target.
Use a per-post calculation to review individual content
For post analysis, the math is still follower-based if follower count is the denominator:
Formula: (Post Engagements ÷ Total Followers at Time of Posting) × 100
The detail that trips people up is timing. Use the follower count from the posting window, not a number from two weeks later after a growth spike or campaign push. Otherwise, the rate looks weaker or stronger for reasons unrelated to the post.
A clean workflow looks like this:
Add the post's likes, comments, saves, and shares.
Pull the follower count from the same period.
Divide engagements by followers.
Multiply by 100.
That gives you a post-level rate you can compare across similar posts. Keep the comparison fair. A Reel aimed at non-followers, a product carousel, and a meme post rarely belong in the same bucket.
Use a monthly average for trend tracking
A monthly average helps when one strong post would otherwise distort the story.
Take the engagement rate for each post published in the last 30 days, then average those rates. This works well for spotting trends, reporting to leadership, or checking whether content changes are improving audience response over time. It is not the best tool for picking your single best post.
Core engagement rate formulas at a glance
Follower-Based Account Check:
Formula: Engagement Rate = (Total Engagements ÷ Total Followers) × 100
Best use: Measure the overall health and engagement of your Instagram community.
Follower-Based Post Check:
Formula: Post Engagement Rate = (Post Engagements ÷ Total Followers) × 100
Best use: Evaluate how a single post performed relative to your total follower count.
Monthly Average Engagement Rate:
Formula: Monthly Average Engagement Rate = Total of all post engagement rates ÷ Number of posts published during the month
Best use: Track engagement trends over time and identify whether your overall content performance is improving.
Which one should you choose?
Choose based on the decision you need to make.
If the goal is community health, use the account-level follower formula. It gives you a steady top-line metric and works well when you need a number you can pull each week consistently.
If the goal is content review, use the per-post version. That helps you judge whether a specific creative angle, caption style, hook, or offer got more response from your existing audience.
If the goal is trend analysis, use the monthly average. It smooths out one-off spikes and gives a clearer read on whether the account is improving or slipping.
For a practical walkthrough of where to pull the underlying numbers inside the app, this guide to Instagram Insights explained is a useful companion.
Beyond Likes and Followers: Advanced Engagement Metrics
A post can look average in a follower-based report and still be the right post to scale. That usually happens when the goal is discovery, not community response. Advanced engagement metrics help you match the formula to the decision.

Use engagement rate by reach for discovery and organic distribution
Engagement Rate by Reach, or ERR, measures how many people interacted after seeing the content.
(Total Engagements ÷ Reach) × 100
Use this when you want to judge content-market fit beyond your follower base. If Instagram shows a post to non-followers and those people save, share, or comment, reach-based engagement captures that response better than a follower-based formula.
This metric is useful for:
Discovery-focused Reels and carousels
Educational posts designed for saves and shares
Testing whether a topic travels outside your existing audience
The trade-off is simple. Reach can swing hard based on distribution, so ERR is great for evaluating how a post performed with the audience it earned, but less reliable for steady account-level reporting.
Use impressions-based engagement for paid campaigns and repeat exposure
Engagement Rate by Impressions answers a different question. It shows how much engagement you got per view, including repeat views from the same person.
(Total Engagements ÷ Total Impressions) × 100
Use this metric when a post gets multiple exposures, especially in paid campaigns, retargeting, or content people tend to rewatch. Reach counts unique viewers once. Impressions count every view. If frequency is high, ERR can make performance look stronger than it is.
Choose impressions-based engagement when the goal is efficiency per exposure, not just response from unique viewers.
Reels should be measured on views, not follower count
Reels break many neat reporting habits. They often reach far beyond your followers, so a follower-based percentage can make a strong Reel look weaker than it was.
A practical Reel formula is:
(Likes + Comments + Saves + Shares) ÷ Views × 100
This gives creators and brand teams a better read on viral potential. If the Reel gets many views but weak interaction, the hook may be working while the content itself is not. If views are modest but saves and shares are strong, that usually points to a format worth repeating with a better opening.
Keep Reels in their own reporting bucket. Static posts, carousels, Stories, and Reels earn attention differently, so combining them into one average hides useful signal. If you are building a reporting system around these distinctions, this guide to Instagram performance metrics by goal and format will help you set it up cleanly.
A simple way to choose the right advanced metric
Use the formula that matches the question:
Community health: follower-based engagement rate
Organic distribution quality: engagement rate by reach
Paid or repeated exposure: engagement rate by impressions
Reels and short-form video performance: engagement rate by views
That framework keeps reporting useful. A good metric is not the one with the highest percentage. It is the one that helps you make the next content decision with less guesswork.
Common Mistakes That Skew Your Engagement Rate
A team sees a post with a high engagement rate, assumes the creative worked, then builds the next month around that result. Later they realize the post was measured with the wrong denominator, grouped with the wrong format, and compared against content with a different job. The math looked clean. The decision was wrong.

Using the wrong follower count
Historical engagement rate only means something if the follower count matches the date the post went live. If you plug today's audience size into a post from three months ago, you distort the result and make trend analysis less reliable.
This shows up often on growing accounts. Older posts can look weaker than they were because the denominator grew later. On declining accounts, the opposite happens.
Use the follower count from the posting date whenever you're calculating follower-based engagement. If you cannot get that number cleanly, label the report as directional rather than precise.
Mixing formats that earn attention differently
A Reel, a carousel, and a static image should not compete inside one average. They earn interaction differently, and they often serve different goals.
The formula used to calculate engagement must align with its purpose. If you're checking community health, a follower-based rate on feed posts can be useful. If you're judging viral potential, views-based reporting on Reels is the better fit. Blend those together, and you lose the signal that helps you decide what to make next.
Keep separate reporting buckets for:
Reels
Carousels
Static feed posts
Stories, if you track them regularly
Teams in visual sales categories already do this because format affects behavior so heavily. The same lesson shows up in examples of using Instagram for real estate listings, where listing videos, photo posts, and educational carousels each pull different kinds of response.
Counting only likes and comments
Old spreadsheets often miss the actions that matter most now. Saves and shares usually tell you more about content quality than likes do, especially for educational posts, product explainers, and carousels.
If your formula ignores saves and shares, you undercount the posts people found useful enough to keep or pass along. That leads to bad calls. A post with modest likes but strong saves may be more valuable than a post that got quick approval and no lasting action.
Comparing posts with different goals
A giveaway post, a founder story, a product tutorial, and a meme should not be judged by one benchmark. The audience responds differently because the content is asking for different behavior.
This is the mistake that turns engagement rate into a vanity metric. The number only helps if it sits next to the post objective. Measure community-building posts against similar posts. Measure reach plays against other reach plays. Measure sales support content by the actions that fit that job, which may include saves, profile visits, link taps, or DMs.
Reading one spike as a strategy
One breakout post can come from timing, topic fit, repost behavior, or plain luck. A single winner is a clue, not a plan.
Look for patterns across a month or a campaign. If carousel posts consistently earn saves, that points to content depth. If Reels get views but weak shares, the hook may be strong while the payoff is weak. If you want a practical framework for fixing those patterns, this guide to improving Instagram engagement organically is a useful next reference.
Good reporting answers one question clearly: which formula helps this specific decision? Once you tie the metric to the goal, engagement rate becomes a management tool instead of a scoreboard.
Actionable Strategies to Boost Your Engagement Rate
Once you know how to measure engagement properly, the next step is improving the behaviors that drive it. That means building for comments, saves, shares, replies, and repeat attention, not chasing empty activity.

Build posts for saves and shares
The most reliable engagement lift usually comes from content people want to keep or pass along. In practice, that means tutorials, checklists, swipeable breakdowns, templates, before-and-after examples, and posts that solve a specific problem.
If you're in a visual sales niche, it helps to study how other industries package that value. This example-driven guide on using Instagram for real estate listings shows how property marketers turn ordinary posts into content that people revisit and share.
Make interaction easy, not demanding
A weak caption asks for too much effort. A stronger caption gives people a narrow decision, a reaction prompt, or a simple comparison.
Try tactics like these:
Use direct opinion prompts. Ask which option they'd choose, what they'd do first, or which slide they disagree with.
Write captions that continue the post. Do not repeat the graphic. Add context, friction, or a practical takeaway.
Work the comments early. When people comment, answer with substance. Real conversation usually produces more conversation.
Comments you earn by asking a better question are more useful than comments you squeeze out with generic “thoughts?” captions.
Use Stories to warm up your audience
Feed engagement does not live in isolation. Story activity often shows whether your audience is primed to respond. Polls, question stickers, slider reactions, and direct replies can surface interest before a feed post goes live.
That makes Stories useful as a testing layer. If a topic gets strong replies in Stories, it is often worth turning into a feed post or Reel.
A deeper walkthrough on how to increase Instagram engagement organically can help if you want a practical checklist for turning those interactions into a repeatable system.
Match the format to the goal
Many engagement strategies fail because teams decide they need “more engagement,” then post the same style of content in every format.
A better approach is to assign jobs:
Reels for reach, discovery, and shareability
Carousels for education and saves
Stories for replies, polls, and warmer audience signals
Static posts for simple announcements or brand moments
If you align the format with the outcome you want, your engagement rate becomes easier to interpret and easier to improve.
Your Top Instagram Engagement Questions Answered
Should you calculate engagement for Stories differently
Yes. Stories need their own scorecard.
If your goal is community health, track Story replies, sticker taps, link clicks, and completion rate separately from feed performance. Stories reach a warmer slice of your audience, so the question is less "How many people engaged?" and more "Did the people who saw this interact in a meaningful way?" Blending Story metrics into a feed-post engagement rate usually makes both sets of numbers harder to interpret.
The rule is simple. Use one consistent interaction set for Stories, and review it the same way each month.
What's a good engagement rate for different industries
There is no single "good" number that works across every account. Industry matters, audience size matters, and content format matters.
Smaller niche accounts often post higher engagement rates because their audience is tighter and more responsive. Larger accounts usually see lower percentages, especially if they rely heavily on reach content. A fashion brand, a local realtor, and a B2B software company should not expect the same baseline.
The better question is this: good for what?
If you're measuring community strength, compare your current rate against your own past 60 to 90 days and against similar accounts in your niche. If you're measuring viral potential, put more weight on shares, saves, and non-follower engagement than on the headline percentage alone.
Can an engagement rate be misleadingly high
Absolutely.
A high rate can come from a giveaway, a controversial post, pod activity, or a Reel that reached people who will never become part of your real audience. That can look great in a report and still be weak for growth.
A simple sanity check helps. Did the post attract the right audience? Did it produce saves, shares, replies, or profile actions? Did the next few posts hold up, or was this a one-off spike? Those answers tell you whether the number reflects real momentum or temporary noise.
If you want help turning these engagement insights into steady Instagram growth, Gainsty is built for that. It helps creators and brands grow with an organic approach focused on real followers and meaningful engagement, so the numbers you're tracking reflect an audience that cares.

.png&w=1920&q=75&dpl=dpl_C723nkStk4By7P6JWE3DQWUAB8y4)






.png&w=750&q=75&dpl=dpl_C723nkStk4By7P6JWE3DQWUAB8y4)