Beyond Vanity Metrics: The Real Instagram Success Indicators
Defining Your Objectives and Key Performance Indicators (KPIs)
The first step is defining your goals. What are you hoping to achieve on Instagram? Are you aiming to increase brand awareness, drive website traffic, generate leads, or boost sales?
Each objective requires a different set of Key Performance Indicators (KPIs). For instance, if your goal is website traffic, clicks on your bio link are a crucial KPI. If brand awareness is your primary focus, reach and impressions become more important.
Moving Beyond Likes and Followers
Likes and followers contribute to the overall picture but offer limited insight into genuine audience engagement. True engagement involves actions that indicate real interest. Think saves, shares, comments, and replies to Stories.
These interactions demonstrate a deeper connection with your content. They are often stronger predictors of future conversions. A saved post suggests the user found the information valuable. A share indicates the content resonated strongly enough to share with their network.
The Importance of Reach and Impressions
Understanding your content's visibility is fundamental to measuring Instagram's success. Reach refers to the number of unique users who see your content. Impressions count the total number of times your content is displayed. Both are vital metrics offered by Instagram.
These metrics are crucial for gauging visibility and identifying areas for improvement. For example, high reach with low engagement might suggest your content isn't resonating. This insight can guide adjustments to your content strategy. Tracking these metrics over time can also reveal trends and inform content optimization. Explore this topic further here.
Measuring Conversions and ROI
Ultimately, the most significant measure of Instagram success is its impact on your bottom line. This involves tracking conversions. Conversions could be website visits, product purchases, or sign-ups, depending on your business goals.
By attributing specific actions to your Instagram efforts, you can calculate the return on investment (ROI). This proves the value of your social media strategy. Tools like Google Analytics, combined with UTM parameters, can help track website traffic from Instagram and measure campaign effectiveness. This data-driven approach ensures your Instagram strategy delivers tangible business results, not just engagement.
Building an Audience That Converts
Growing a large Instagram following is great, but it's meaningless if those followers aren't interested in your business. This section explores how to truly measure Instagram's success. We'll go beyond vanity metrics like follower count and dive into analyzing audience quality and identifying behaviors that predict real business results.
Analyzing Follower Growth Trends
Analyzing follower growth involves examining both quantitative and qualitative indicators. Quantitative metrics, such as follower growth rate, give you the hard numbers on how quickly your account gains or loses followers. This helps you understand how effective your content strategy is.
A positive follower growth rate, for example, suggests your content is engaging and attracting new users. Measuring Instagram success often begins with tracking this rate. You calculate it by dividing the number of new followers in a given period by the initial number of followers, then multiplying by 100.
For example, if you started with 10,000 followers and gained 200 in a month, your growth rate would be 2%. This helps businesses understand whether their content resonates with their target audience and if they need to adjust their strategy. You can find more detailed Instagram statistics at Hootsuite.
Qualitative indicators, on the other hand, focus on who your followers are: their demographics, interests, and how they interact with your content. This information helps paint a richer picture of your audience.
Identifying Concerning Patterns in Follower Churn
Gaining followers is important, but it's equally crucial to understand why you might be losing them. A high follower churn rate—the rate at which people unfollow you—can indicate issues with your content, posting frequency, or brand messaging. Identifying these concerning patterns early allows you to make necessary changes before engagement drops significantly.
Measuring the Genuine Quality of Your Audience
The true quality of your audience isn’t about the number of followers. It lies in their level of engagement and their potential to become customers. This means going beyond superficial likes and focusing on meaningful interactions, such as comments, saves, and shares. These actions demonstrate a deeper connection with your content and are usually stronger indicators of potential purchases.
Benchmarking and Identifying Warning Signs
Benchmarking your performance against competitors in your industry provides valuable context. It helps you understand where you stand and identify areas for improvement. There are several warning signs your content strategy needs tweaking, such as a declining engagement rate, a high follower churn rate, or a low conversion rate. Proactively addressing these issues is essential for maintaining a successful Instagram account.
To further analyze your follower growth, consider the following framework:
Here's a table to help guide your follower growth analysis:
Follower Growth Analysis Framework: A structured approach to analyzing follower metrics across different timeframes
The Follower Growth Rate is calculated as (New Followers / Starting Followers) * 100 weekly. It indicates the overall trend of audience growth. If growth is slow, adjust the content strategy.
Monthly, the Follower Churn Rate is determined using (Unfollowers / Starting Followers) * 100. A high churn rate may signal issues with content or brand messaging. Reviewing content and engagement tactics can help.
Quarterly, the Engagement Rate is calculated as (Total Engagements / Total Reach) * 100. It reflects audience interest and content effectiveness. Experimenting with different content formats can improve engagement.
Annually, the Conversion Rate is measured by (Number of Conversions / Total Followers) * 100. This metric assesses Instagram's effectiveness in driving business goals. Refining targeting and call-to-actions can enhance conversions.
This table provides a structured approach to analyzing follower growth and identifying potential issues. By tracking these metrics over time, you can gain valuable insights into your audience and optimize your Instagram strategy for better results.
Engagement Metrics That Predict Success
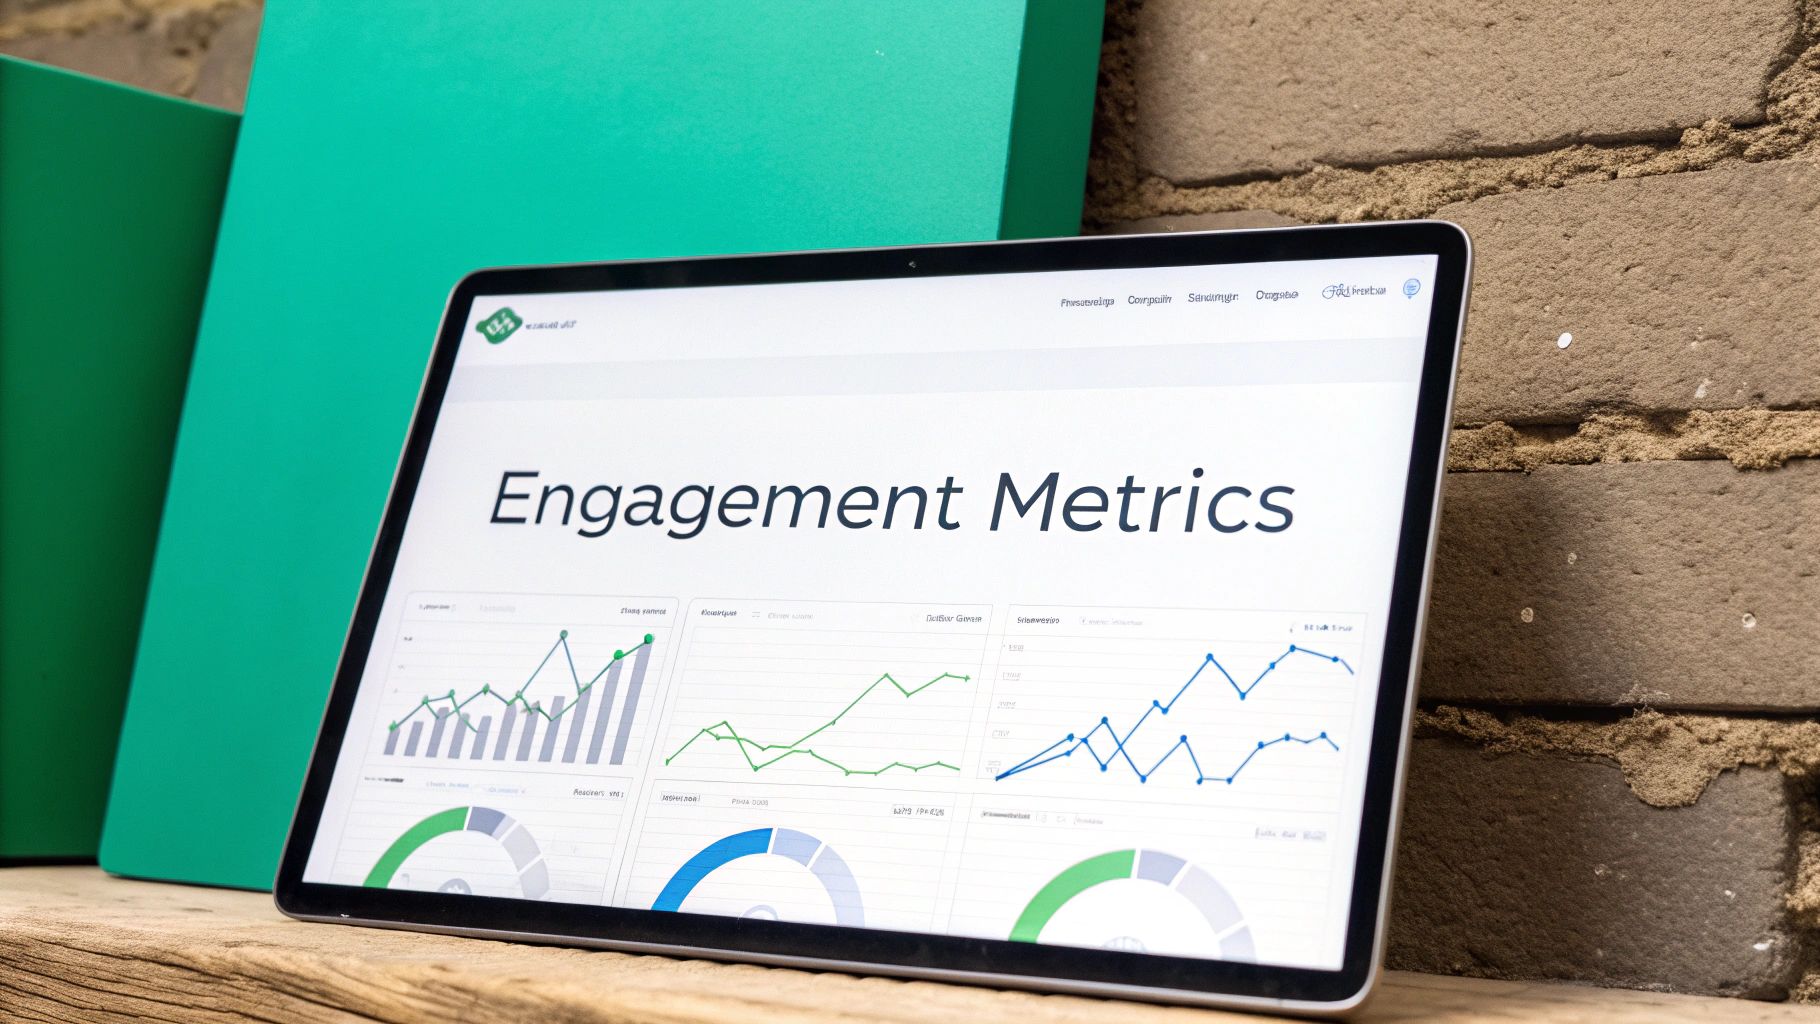
Not all engagement on Instagram is created equal. While likes offer a glimpse into visibility, they don't always translate into meaningful interactions or tangible business results. This section explores the hierarchy of Instagram engagement, highlighting the metrics that truly indicate success. For instance, comments, saves, and shares often hold greater significance than likes, impacting both the algorithm and your business goals.
Beyond Likes: The Power of Comments, Saves, and Shares
Comments, even brief ones, show that your content has resonated with users, prompting them to engage. Saves indicate valuable and relevant content users want to revisit, suggesting a lasting impact. Shares extend your reach to new audiences through social connections, creating a powerful ripple effect. These actions signal genuine interest and contribute significantly to your overall Instagram success. For further insights, check out this resource: How to master your Instagram engagement strategy.
Calculating Meaningful Engagement Rates
Simply tallying likes, comments, and shares isn't sufficient. Accurate measurement requires calculating meaningful engagement rates, which contextualize engagement relative to audience size or reach. A key metric is the engagement rate by reach, calculated by dividing total engagements by reach and multiplying by 100. This metric reveals the percentage of users who interacted with your content after viewing it, offering a more precise measure of content effectiveness than raw engagement numbers alone.
Engagement Patterns and Purchasing Behavior
Specific engagement patterns can correlate with purchasing behavior. Numerous saves on product posts can suggest purchase intent, while comments inquiring about product details or availability can indicate strong buying interest. By monitoring these patterns, you can identify potential customers and refine your strategy accordingly. This data-driven approach links engagement metrics to revenue generation.
To help illustrate the importance of different engagement metrics, let's look at a comparison list:
Instagram Engagement Metrics Comparison
These compare various engagement metrics and their significance for business goals.
Likes measure visibility and initial interest. They provide surface-level engagement but don’t always translate to conversions. To improve, use eye-catching visuals and relevant hashtags. A red flag is high likes but low engagement in other areas.
Comments indicate active interest and dialogue. They demonstrate content resonance and provide valuable feedback. To increase comments, ask questions, and respond to interactions. A red flag is a low comment count or negative comments.
Saves reflect value and relevance, indicating a desire to revisit content. They have long-term impact potential. Improve by creating save-worthy content and providing valuable information. A red flag is a low save count.
Shares measure reach and amplification, helping extend content to new audiences and increasing brand visibility. To enhance shares, create shareable content with engaging visuals. A red flag is a low share count.
Reach represents audience exposure, showing how many users saw your content. Improve it by optimizing posting times and using targeted advertising. A red flag is low reach compared to followers.
This comparison highlights the value of moving beyond likes and focusing on deeper engagement metrics like comments, saves, and shares.
Optimal Posting Cadence and Fostering Engagement
The ideal posting frequency, or posting cadence, varies depending on your audience and their responsiveness. Analyze their engagement patterns over time to pinpoint the optimal times and days for posting, maximizing visibility and engagement. Encouraging specific engagement types, such as asking questions to spark comments or crafting save-worthy content, can further enhance your Instagram success.
Connecting Engagement to Revenue
The ultimate measure of Instagram's success lies in its contribution to your business objectives, specifically connecting engagement to revenue. Tracking website clicks from your bio link, using UTM parameters from Google Analytics to measure campaign conversions, and analyzing the correlation between engagement and sales reveals the true ROI of your Instagram strategy. This framework justifies your social media investment and demonstrates the tangible business value of a thriving, engaged Instagram community.
Measuring Content That Performs (Not Just Impresses)
Creating compelling content takes time, effort, and resources. Accurately measuring its impact is essential for success on Instagram. This isn't about vanity metrics like simple counts. It's about understanding what content connects with your audience and drives tangible business results.
Beyond Surface Metrics: Identifying High-Performing Content
Measuring true Instagram success requires a deep dive into content performance across various formats. This includes images, videos, carousels, Reels, and Stories. Go beyond likes and delve into more substantial engagement metrics such as comments, saves, and shares. These actions demonstrate a deeper connection with your content. For example, a saved post indicates the user found value and plans to refer back to it. Shares expand your reach to new audiences, increasing visibility and potential followers.
This analysis helps pinpoint which formats, topics, and visual styles resonate most. You can then replicate successful patterns for consistent results. Focusing on high-quality engagement provides a clearer understanding of audience preferences.
Attributing Business Outcomes to Content Strategies
Connecting Instagram content directly to business outcomes can be a challenge. Establish clear Key Performance Indicators (KPIs) and track conversions. For instance, if your goal is to drive traffic to your website, track clicks on the link in your bio. Bitly is a useful tool for creating trackable, shortened links.
A data-driven approach helps justify your Instagram investment and demonstrate its Return on Investment (ROI). Analyzing high-converting campaigns reveals which content strategies effectively drive desired actions. This informs future content planning and ensures your efforts align with your business objectives. You might be interested in: How to master hashtag research with our Hashtag Generator.
Content Audits and Continuous Improvement
Regular content audits are key for sustained success. These audits involve systematically reviewing past content to identify trends in high-performing posts. Analyze the format, topics, visuals, captions, and hashtags of successful content. What patterns emerge? What stories resonate most with your audience?
This process helps refine your content strategy for continuous improvement. Implementing A/B testing with different content variations further optimizes your approach. Consistently analyzing and adapting based on data ensures your Instagram content remains engaging and effective across your audience segments. This means continuous learning and improvement, the foundation of long-term success on Instagram.
Understanding Your Audience Beyond Basic Demographics
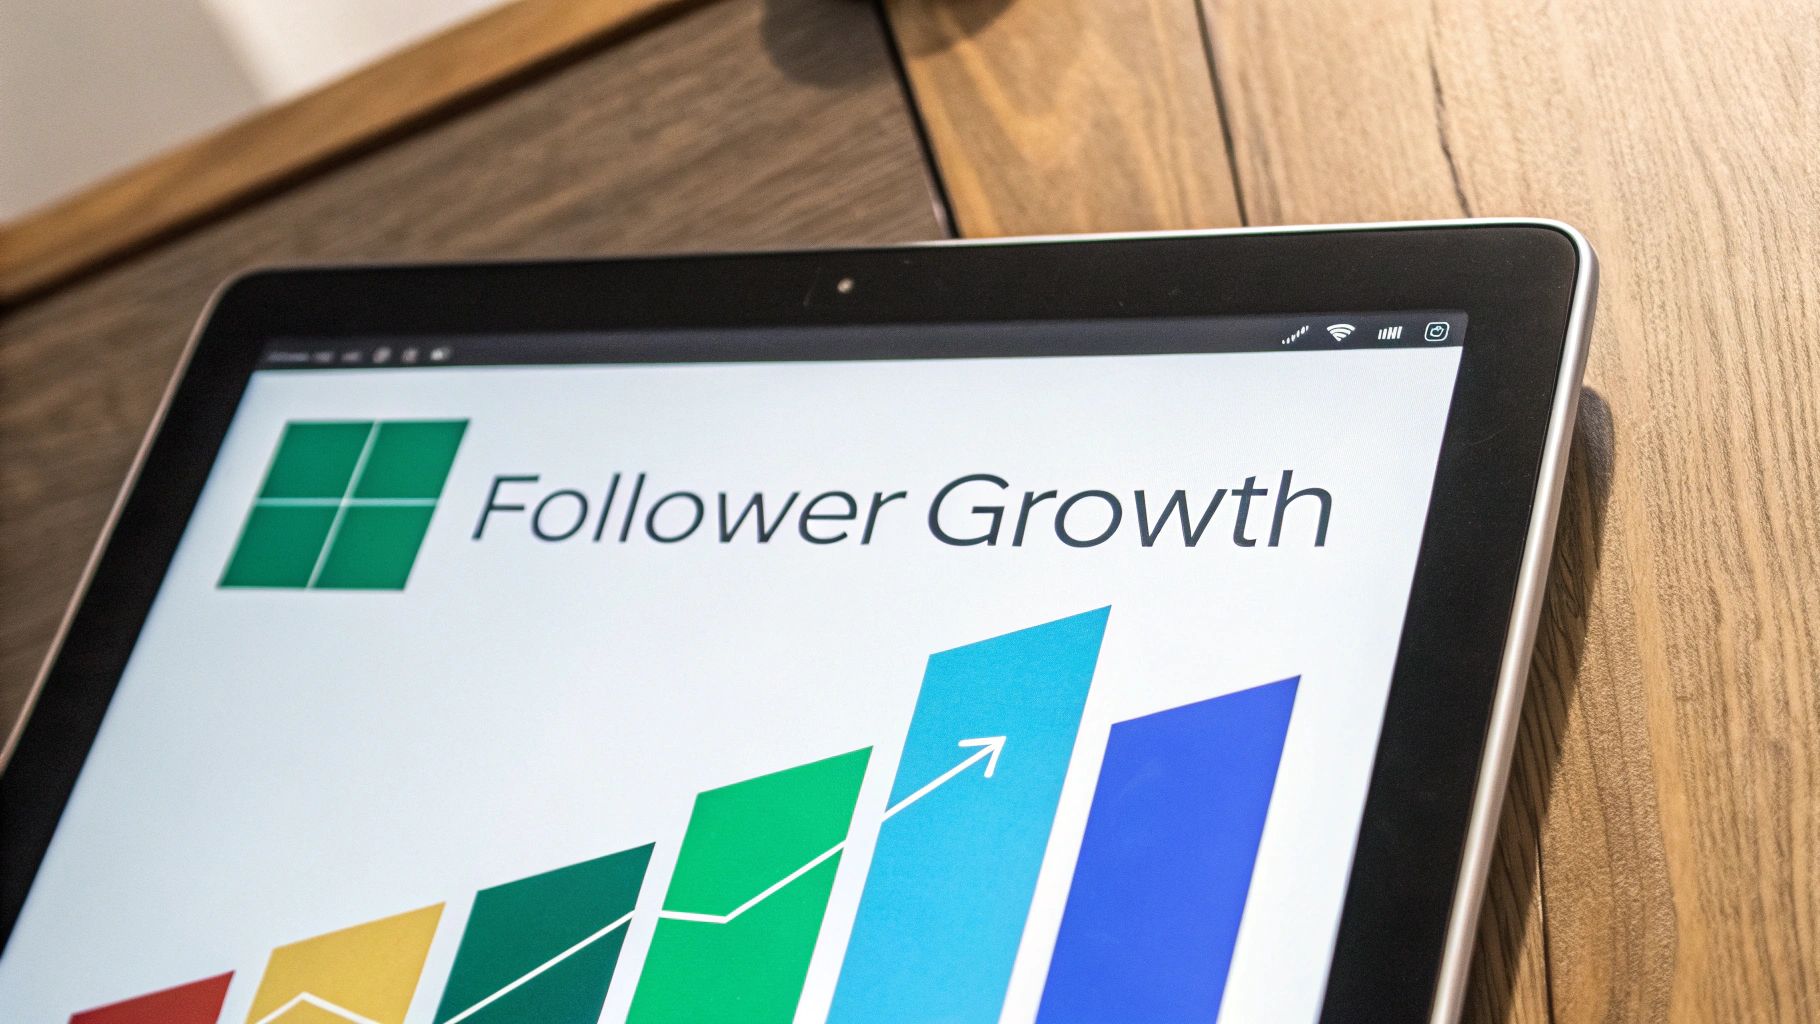
Measuring Instagram's success depends on truly understanding your audience. This means going beyond simple demographics like age, gender, and location. To genuinely connect, you need to understand their motivations. This involves exploring psychographics: the study of people's attitudes, aspirations, and psychological criteria. This section explores how you can gain these valuable insights using Instagram's built-in analytics and other helpful tools.
Identifying Your Most Valuable Audience Segments
Instagram's native analytics offer a lot of information about your followers. But to truly understand your audience, you need to identify key segments. Audience segmentation means dividing your followers into groups based on shared characteristics. These could be interests, behaviors, or even past purchases. This targeted approach allows you to tailor your content for maximum impact. For example, if you identify a segment interested in sustainable products, you can create content specifically promoting eco-friendly items to that group.
Analyzing Peak Activity Times and Interest Clusters
Timing matters on Instagram. By analyzing peak activity times, you understand when your audience is most engaged. This allows you to optimize your posting schedule for maximum visibility. Similarly, understanding interest clusters reveals what topics and trends resonate with your followers. Imagine noticing a surge in engagement whenever you post about travel. This insight suggests a strong interest in travel-related content and can guide your future content strategy.
Behavioral Signals and Purchase Intent
Certain behaviors can indicate purchase intent. For example, repeatedly saving product posts, interacting with shopping tags, or clicking links in Stories suggest a strong buying interest. By recognizing these signals, you can target specific audiences with tailored promotions, increasing conversions. This data-driven approach connects audience behavior to business results, driving tangible outcomes. You might be interested in: How to use Gainsty for business.
Competitor Analysis and Growth Opportunities
Analyzing your competitors' followers can uncover growth opportunities. Look for overlapping interests and behaviors between your audience and theirs. This insight allows you to target competitor followers with content tailored to their preferences. You can learn from your competitors’ successes and find untapped audience segments. This helps you stay ahead and expand your reach.
Transforming Insights into Resonant Content
Understanding your audience's psychographics helps you create content that truly resonates. Instagram's influence on cultural trends is significant, making it a key platform for businesses. As of April 2024, Instagram had 2 billion active users worldwide, making it the third most-used social media platform globally. Hootsuite Blog on Instagram Statistics provides more detailed statistics. This broad user base provides businesses with a vast audience to engage with. Understanding your audience allows you to craft content that speaks to their values, aspirations, and needs, building stronger brand loyalty and deeper engagement. Rebuilding these insights into resonant content is key to maximizing your impact and reach.
Stories and Reels: Measuring What Works
Ephemeral content, like Stories and Reels, requires a different approach to measuring Instagram success than standard feed posts. These short, engaging videos offer unique metrics that provide insights into genuine audience interest, differentiating between active engagement and passive scrolling. Understanding this difference is key to optimizing your content and achieving your Instagram objectives.
Decoding Story Metrics: Completion Rate and Interactions
For Stories, the completion rate is a crucial metric. It shows the percentage of viewers who watch your Story from beginning to end. A high completion rate indicates captivating content that holds the audience's attention. This provides valuable feedback on the quality and resonance of your Stories.
Beyond the completion rate, analyzing navigation patterns is essential. Are viewers tapping through quickly, or pausing and interacting with elements like polls, quizzes, or question stickers? These behaviors offer insights into content pacing and audience interest. For example, a high exit rate on a specific Story slide could signal an issue with that content. Responses to interactive elements also provide valuable audience data.
Measuring Reels Performance: Watch Time and Shares
Reels utilize different metrics, primarily focusing on watch time. This metric represents the total time users spend viewing your video, signifying a deeper level of engagement than simple views. Sharing frequency, or how often viewers share your Reel, demonstrates its resonance and potential for virality.
Like Stories, analyzing comments and reactions on Reels offers deeper insights into audience sentiment and preferences, enabling you to tailor future content more effectively. Engagement depth for Reels involves examining the ratio of likes, comments, and shares to views. A Reel with high watch time and sharing frequency indicates compelling content that connects with viewers.
Benchmarking Success and Optimization Strategies
Analyzing successful campaigns helps identify industry-specific benchmarks to aim for. Comparing your performance against industry averages provides context for your metrics and informs your optimization strategy. Leading brands often use this data-driven approach to develop highly effective short-form video content.
This allows for strategic optimization techniques. For instance, a low completion rate on Stories might lead to adjustments in pacing, storytelling, or incorporating more interactive elements. Similarly, low watch time on Reels could indicate a need for more engaging visuals, shorter videos, or stronger calls to action.
Tailoring Content for the Short-Form Environment
These metrics empower you to create content that captures attention in the competitive short-form video landscape. This includes adapting content formats to suit audience preferences, optimizing video length for maximum impact, and using interactive features to boost engagement. These strategies are essential for thriving on Instagram.
Creating Your Strategic Instagram Measurement Dashboard
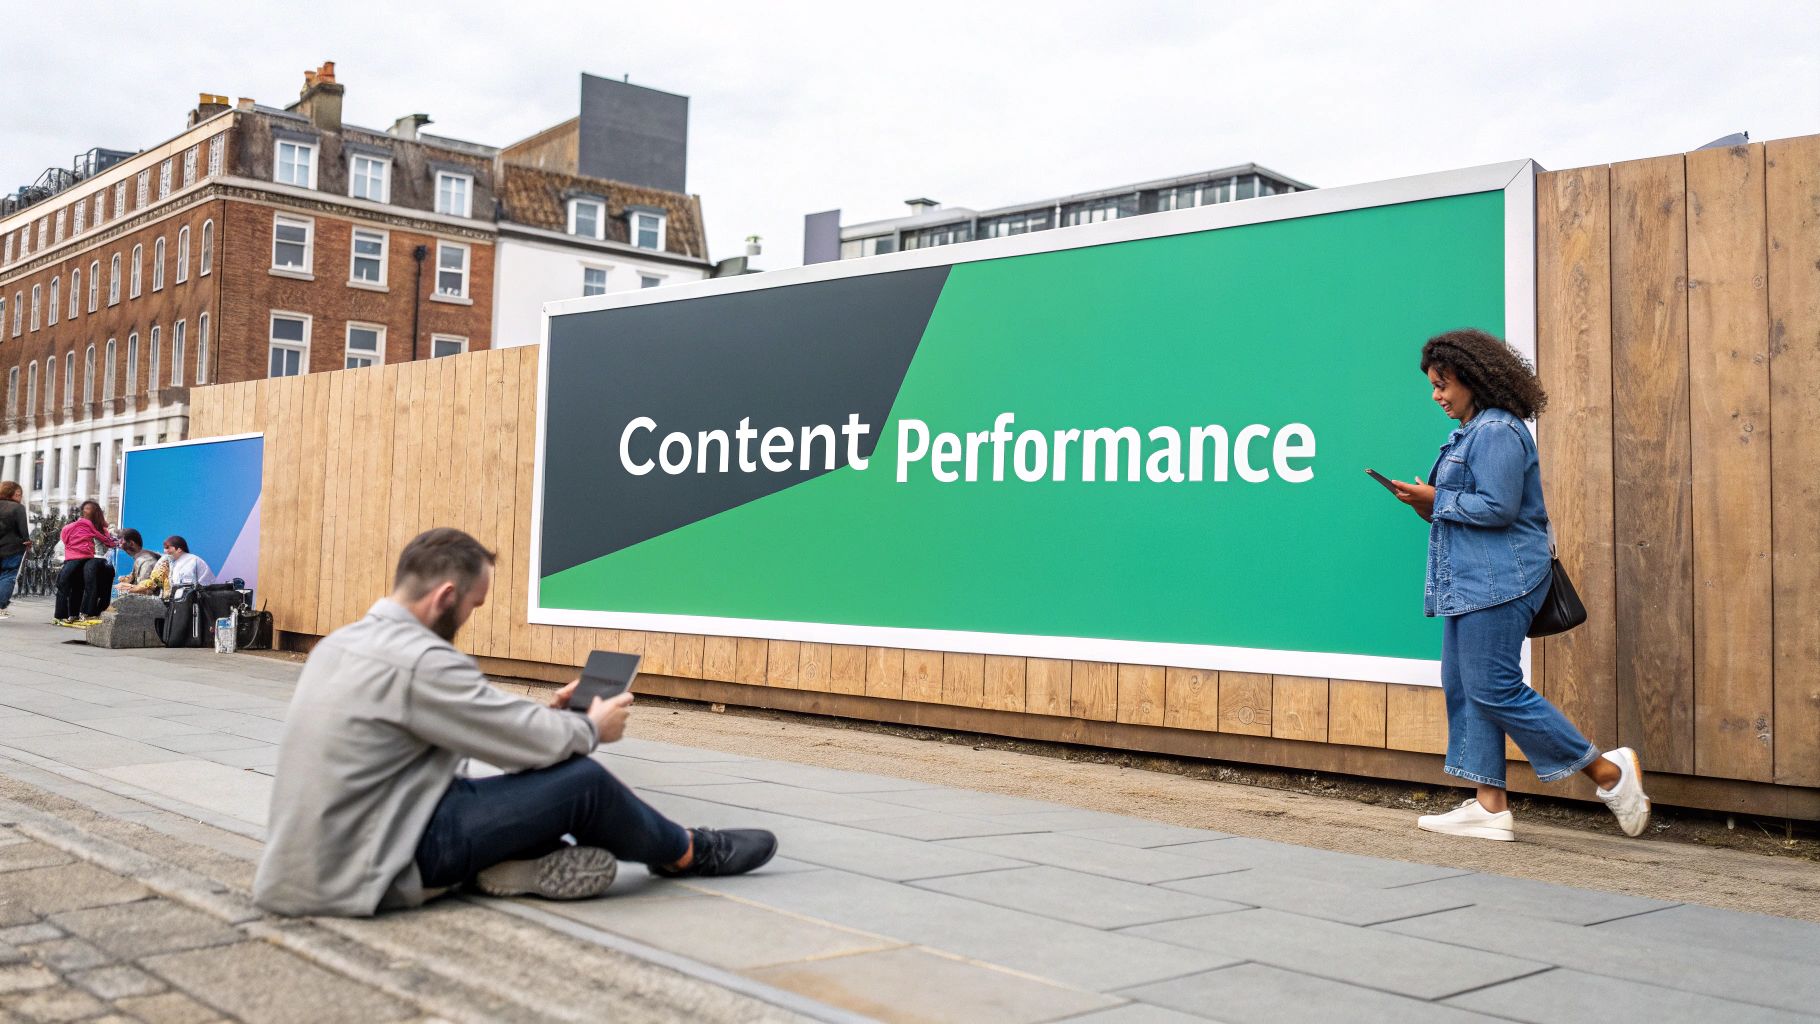
Understanding your Instagram success hinges on bringing all your data together into one cohesive view. This means building a customized Instagram measurement dashboard that directly connects your platform activity to your business goals. It involves the right tools, relevant KPIs (Key Performance Indicators), and efficient reporting.
Selecting the Right Measurement Tools
A successful measurement strategy starts with choosing the right tools. Instagram's native insights are a good starting point. They offer basic metrics like reach, impressions, and engagement.
But for a deeper dive, consider exploring third-party tools. These often offer more advanced features like competitor analysis and hashtag tracking, providing a much richer understanding of your Instagram performance. Some even offer automated reporting, saving you time and effort. The key is to find tools that fit your specific needs and budget.
Establishing KPIs That Link to Revenue
Your KPIs should be a direct reflection of your business objectives. If your goal is driving sales, focus on metrics like website clicks from your Instagram profile and conversion rates. For example, track how many profile link clicks lead to purchases. This directly links Instagram activity to revenue.
If your goal is brand awareness, prioritize reach and impressions. Choose KPIs that are measurable, achievable, relevant, and time-bound. These KPIs should clearly show how your Instagram efforts contribute to overall business success.
Implementing Efficient Reporting Processes
Building a dashboard is just the first step. Using it effectively requires streamlined reporting. Consistent reporting provides ongoing insights without overwhelming your team.
Consider different reporting frequencies for different stakeholders. Weekly reports might work for short-term campaigns, while monthly or quarterly reports offer a broader view of long-term progress.
Dashboard Design and Reporting Cadence
A well-designed dashboard lets you spot critical trends at a glance. Focus on clear, concise data visualization. Charts and graphs are often better than raw numbers for quickly identifying patterns and insights.
Choose a reporting cadence—daily, weekly, monthly—that works for your team and their information needs.
Identifying Emerging Opportunities
Your dashboard should not just track past performance; it should help you identify emerging opportunities. For example, monitoring engagement trends across different content types reveals what resonates with your audience. This allows you to create high-performing content.
Tracking competitor activity can also reveal what's working for them, letting you stay ahead of the curve and refine your Instagram strategies.
Ready to boost your Instagram growth? Gainsty, an AI-powered social assistant, helps you organically grow followers and engagement authentically. No bots, no fake followers, just real growth. Learn more about how Gainsty can help you achieve Instagram success.


.png&w=1920&q=75&dpl=dpl_8YjY2AdZtmqizmVC1J4YDDwBcdzb)





.png&w=750&q=75&dpl=dpl_8YjY2AdZtmqizmVC1J4YDDwBcdzb)
