What Instagram Analytics Insights Actually Are
Instagram Insights is Instagram's native measurement layer. It collects account, audience, and content data inside the platform, while analytics is the wider practice of interpreting that data and using it to make decisions. Insights gives you the numbers. Analytics gives those numbers meaning.
You'll find native reporting inside Instagram's professional tools and through Meta Business Suite on desktop. The interface may change, but the underlying purpose stays consistent: help you understand who saw your content, how they interacted with it, and which content formats deserve more attention.
The difference between checking data and using analytics
Opening Insights after every post is monitoring. Comparing several posts, identifying a pattern, forming a hypothesis, and changing your content plan is analytics.
For example, suppose a carousel receives modest likes but generates more saves than your recent image posts. A vanity-metric reading might call it average. An analytical reading asks:
Did the carousel reach a different audience?
Did people visit the profile after seeing it?
Did the saves come from existing followers or non-followers?
Can the same educational idea be developed into a Reel or Story?
Did the post create useful demand, even if it didn't create visible excitement?
This approach matters whether you're a solo creator, a local business, an ecommerce brand, or an agency managing several accounts. A personal account can rely on instinct for a while. A business channel needs evidence because every content decision consumes time, creative energy, and often budget.
Practical rule: Never label a post a success or failure until you connect its result to the objective it was meant to support.
Start by writing down the purpose of each content type. Reels may support discovery, carousels may support education, Stories may support conversation, and profile content may support conversion. Then choose the Insights metrics that reflect that purpose. This simple step prevents you from judging every post by likes alone.
A Brief History of Instagram Insights
Instagram Insights became part of Instagram's business tools rollout in August 2016, when Instagram introduced business profiles, analytics, and promoted posts for an advertiser base of about 200,000 businesses. The launch gave professional accounts a native way to evaluate post effectiveness and audience interaction instead of relying only on likes, comments, and follower counts, as documented in this history of Instagram engagement and analytics.
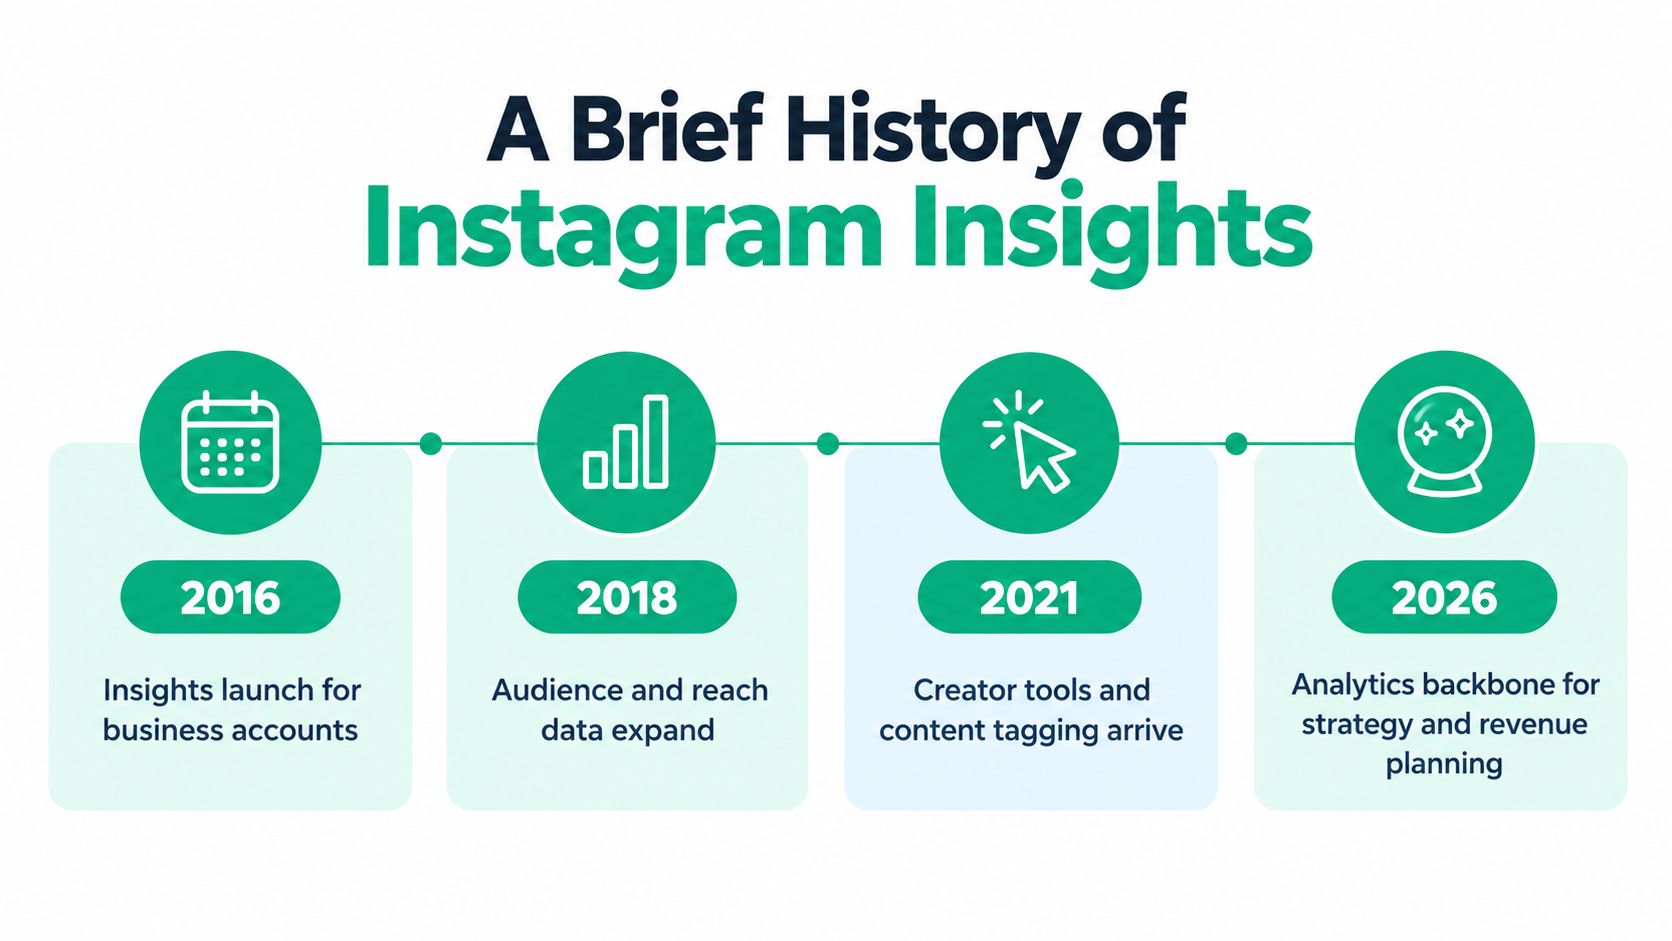
That change seems ordinary today, but it altered how brands worked on Instagram. Before native measurement became central, a business could publish content and count visible reactions, but it had limited access to a consistent view of reach, audience characteristics, and content-level performance. Insights turned Instagram into a channel that could be managed through feedback rather than intuition alone.
The dashboard expanded as Instagram added more ways to publish and promote content. Stories, Reels, Live video, and paid promotion each created different questions, so the reporting experience had to become more format-specific. A Story needs different interpretation from a Reel, just as a boosted post needs to be separated from organic distribution.
Why older guides can mislead you
Instagram's terminology has also changed. During 2025 and 2026, Instagram moved away from impressions-style reporting and standardized Views across formats, according to Socialinsider's 2026 Instagram benchmark coverage. That shift makes older screenshots and historical comparisons harder to interpret.
The practical lesson is simple. Preserve the date range, content format, and metric definition whenever you export or record performance. A number from an older report may describe a different measurement label from the one shown in your current dashboard.
How to Access Instagram Insights
You need a professional Instagram account to access the full native reporting experience. If Insights isn't visible, check whether the account is set up as a Creator or Business profile rather than a personal profile.
Finding reports on mobile
Open Instagram and go to your profile. From there, open the Professional Dashboard and select Insights or See All Insights. The labels can vary by account type and app version, but the main reporting areas usually follow the same logic:
Overview shows account-level performance for the selected period.
Content lets you inspect individual posts, Stories, Reels, and other published formats.
Audience provides available information about followers, locations, demographics, and activity patterns.
You can also open an individual post, Story, or Reel and tap View Insights. This route is useful when you're diagnosing one piece of content, while the Professional Dashboard is better for spotting account-level patterns.
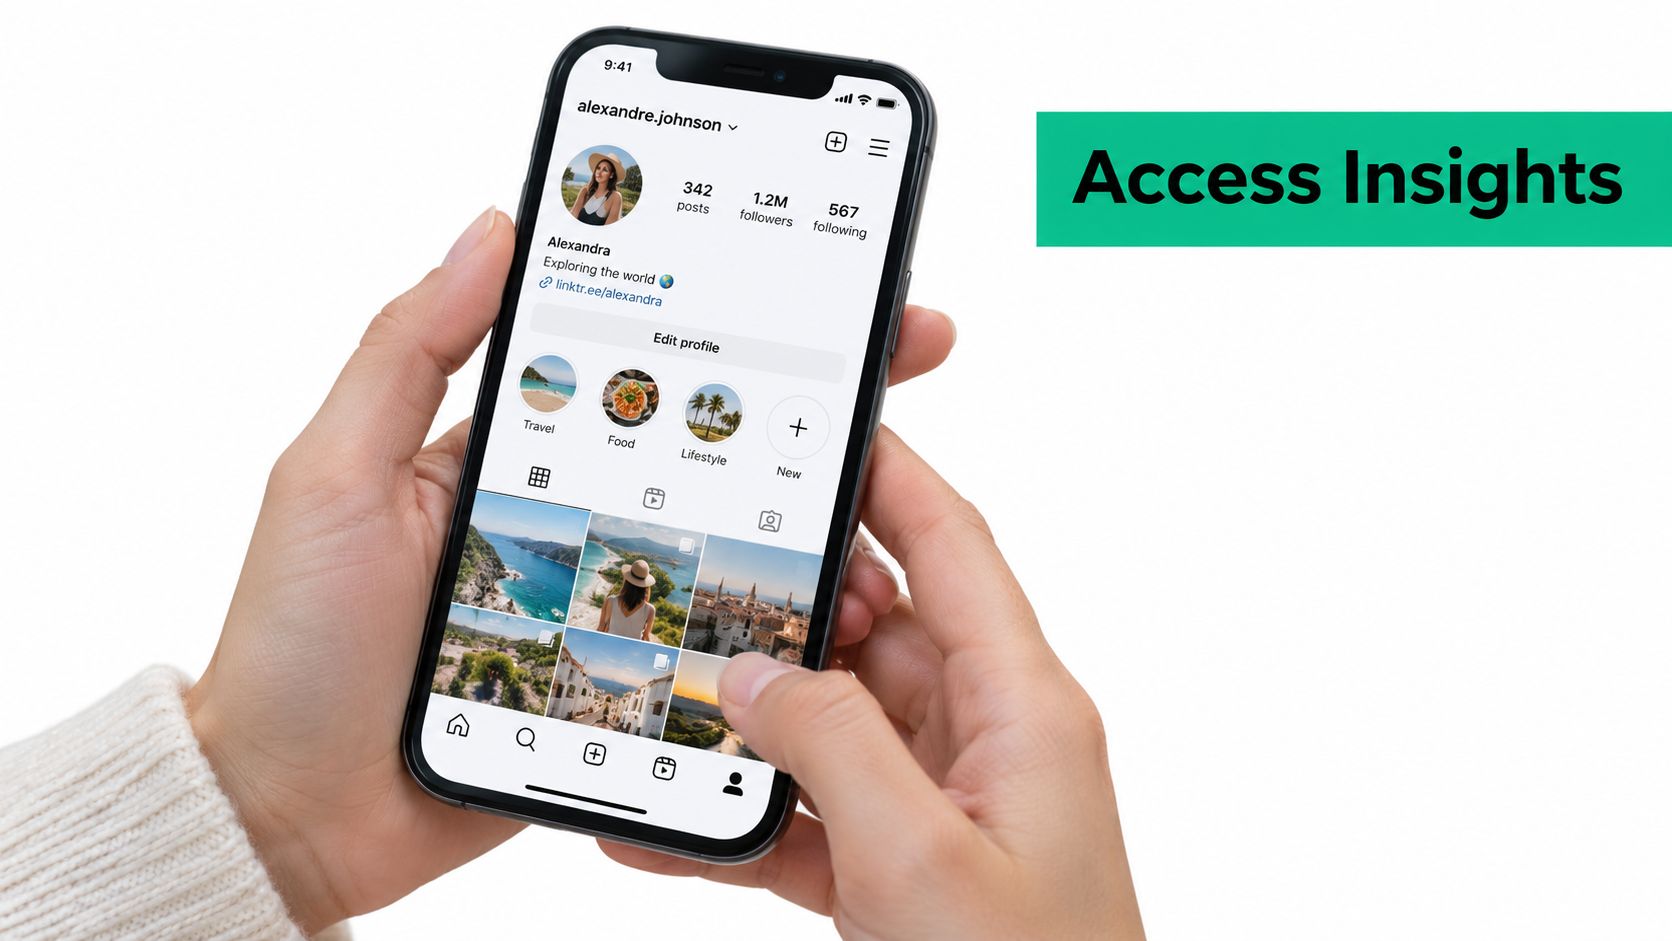
If you want a visual walkthrough of the mobile process, this guide on how to see analytics on Instagram can help you locate the relevant screens.
Finding reports on desktop
For desktop work, open Meta Business Suite and select the Instagram account connected to your business portfolio. Its Insights area is more practical for reviewing multiple posts, comparing formats, and preparing a report than a phone screen.
If Reels, Live, or Story data doesn't appear, first check that the relevant content was published from the professional account you're reviewing. Also verify that the Instagram account is correctly connected to the right Meta Business Suite portfolio. Account permissions and recent interface changes can affect what each user sees.
The Core Metrics You Need to Understand
A metric is useful only when you know what behavior it represents. Start with these core measures, then connect them to the stage of the audience journey they describe.
Discovery metrics
Reach counts the unique accounts exposed to a post. Views, which now replaces impressions-style reporting across many Instagram surfaces, counts content views and can include repeated exposure. The distinction matters because one post can reach a relatively small group while accumulating many Views, or reach a broad group with fewer repeat views. The definitions and practical difference between unique exposure and repeated viewing are explained in this guide to reach and impressions.
A high Reach number suggests distribution. It doesn't automatically prove that people understood, remembered, or valued the content. Views add context about consumption, but they also shouldn't be mistaken for unique audience size.
Interest and relationship metrics
Profile visits show that someone wanted more information after encountering your content. That action is closer to consideration than a passive view.
Follows show that the profile visit became an ongoing relationship. Compare profile visits with follows rather than viewing either number in isolation. A post may attract curiosity without explaining clearly why someone should stay.
Likes are quick public reactions. They can help you understand immediate approval, but they require less effort than a save, share, meaningful comment, or profile visit.
Value and conversation metrics
Comments can reveal questions, objections, opinions, or requests. Count alone doesn't tell you whether the conversation is useful, so read the comments and categorize them.
Shares show that someone passed the content to another person or surface. They're particularly useful for identifying ideas that audiences consider relevant beyond the original viewing session.
Saves indicate that someone wants to return to the content. Tutorials, checklists, explanations, and reference material often depend on this behavior more than on visible enthusiasm.
Reach measures unique accounts exposed to your content, so it mainly signals distribution breadth at the discovery stage. Views measure total content views, including possible repeat views, so they reflect consumption and repeated exposure during discovery. Profile visits show when people move from passive exposure to curiosity and consideration. Follows represent new ongoing account relationships, which means interest has converted into a longer-term connection. Likes are quick public approval signals and usually reflect immediate reaction. Comments reveal written audience responses, which can include conversation, questions, or disagreement. Shares show that people found the content relevant enough to pass along to another person or surface. Saves indicate that the content had enough utility for someone to bookmark it for later, which points to future intent.
Use the metrics together. Reach tells you whether Instagram distributed the post. Profile visits tell you whether the content created curiosity. Saves and shares help you judge whether the idea had enough value to preserve or recommend.
The Essential Reports Inside the Dashboard
Instagram Insights becomes easier to use when each report has a job. Don't open every screen and collect every available number. Open the report that answers the decision in front of you.
Overview supports trend checks
The Overview report gives you an account-level view of reach, engagement, and follower movement over a selected period. Use it to identify direction rather than to celebrate a single spike. If performance changes, move into Content to find the posts or formats responsible.
Content reveals repeatable patterns
The Content report lets you compare individual posts and formats. Sort or filter by the metrics that match the content's purpose. For discovery content, inspect Reach and Views. For educational content, examine saves and shares. For community content, read comments and review replies rather than relying on a single engagement total.
Audience informs creative choices
The Audience report helps you understand who follows the account and when they're active. Use locations and demographic information to check whether your current audience matches your intended audience. Activity patterns can inform testing, but they shouldn't replace content quality or audience feedback.
Format reports answer different questions
Stories, Reels, and Live content need separate analysis because the audience experience differs. Stories can reveal replies and exits, Reels can reveal how widely short-form video travels, and Live reports can help you understand participation during a longer session. Promotions should be reviewed separately so paid distribution doesn't make organic content appear stronger than it is.
The Overview report shows account-level reach, engagement, and follower direction, so it helps you decide whether the overall strategy needs to change. The Content report shows performance by post and format, which makes it useful for deciding which ideas deserve another test. The Audience report highlights locations, demographics, and activity patterns, helping you decide who the content should serve. Story reports focus on viewing and interaction behavior, so they help you identify which sequence keeps people participating. Reel reports focus on short-form video distribution and interactions, which makes them useful for spotting hooks or subjects that support discovery. Live reports show participation during broadcasts and help you judge which topics justify another live session. Promotions reports isolate results from boosted or paid activity, so you can decide whether paid distribution supported the campaign goal.
A useful report contains an observation and a decision. “Carousel saves increased” is an observation. “Create a follow-up carousel that answers the most common question from that post” is a decision.
Engagement Rate and 2026 Benchmarks
Engagement rate describes the relationship between interactions and the audience used as the denominator. The denominator changes the question you're asking.
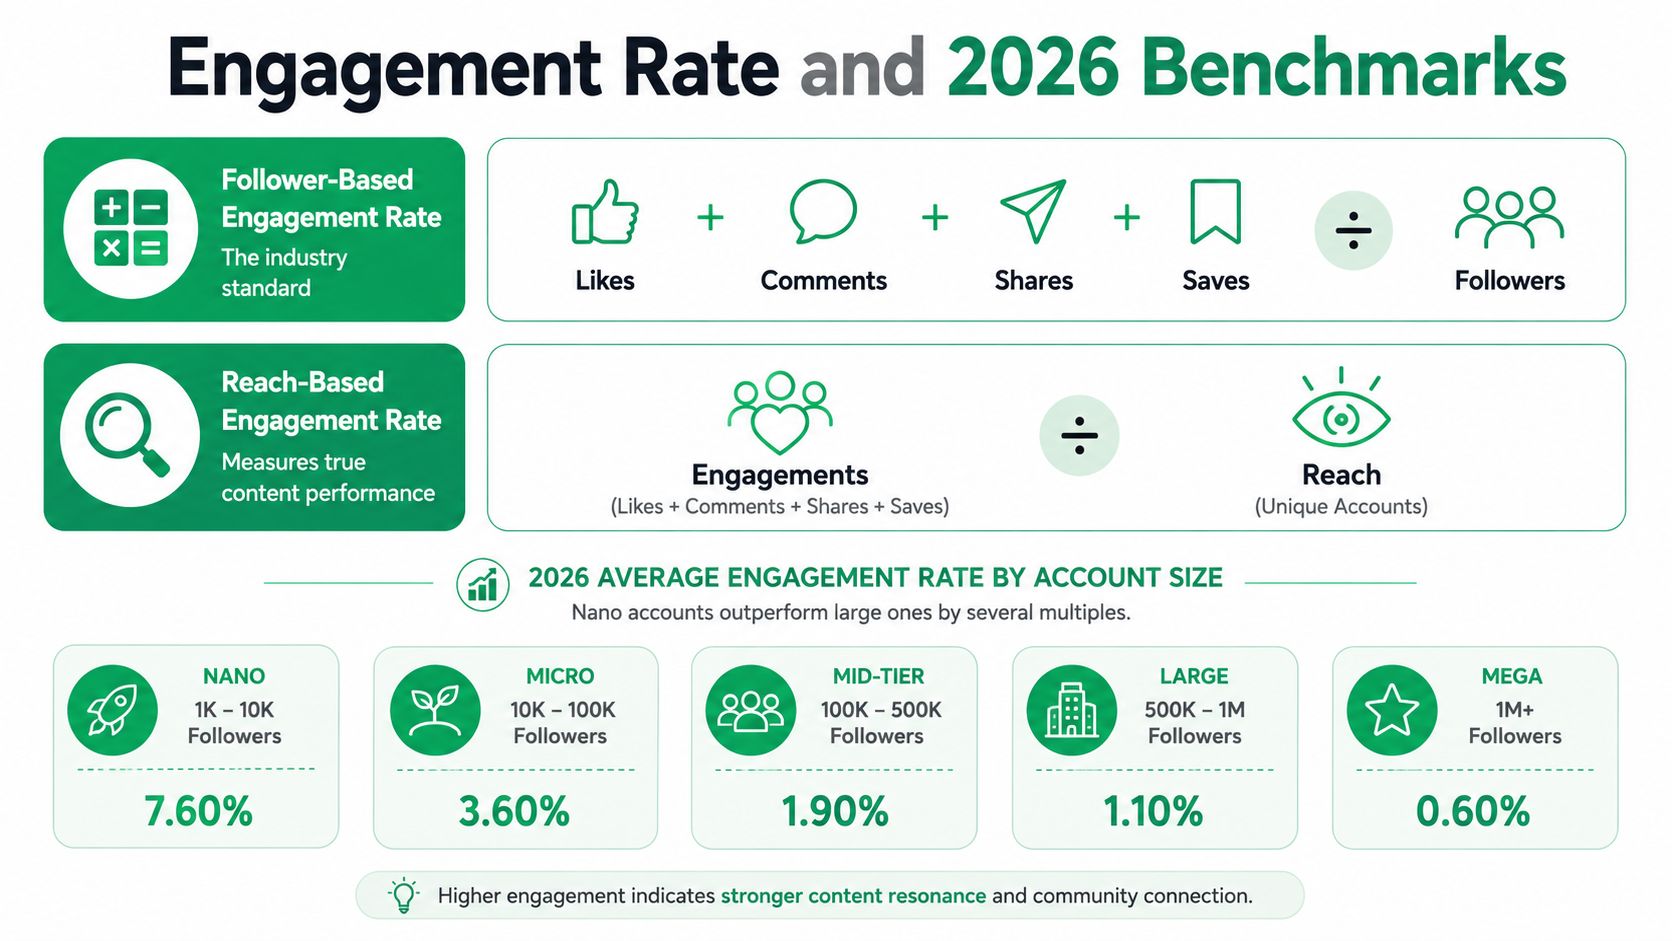
The follower-based formula is:
(Likes + comments + shares + saves) ÷ followers × 100
This version helps with broad comparisons between accounts, although it can be distorted by inactive followers or by people who never saw the post.
For content-level analysis, use:
Engagements ÷ reach × 100
This reach-based approach asks how efficiently a specific post turned exposure into interaction. It's more useful when two posts received very different distribution. A post with fewer total engagements may have created stronger engagement among the people who saw it.
Reading the current baseline
Instagram is a mature, crowded platform. By 2026, it had more than 3 billion monthly active users and 2 billion daily active users, while benchmark data showed comparatively low and format-dependent average engagement. One benchmark placed platform-wide engagement around 0.48% in 2025, with carousels at 0.55%, Reels at 0.52%, and images at 0.37%, as reported in Metricool's Instagram statistics.
A separate 2026 benchmark reported overall engagement at 0.45% in Q2, down from 0.50% in Q1 for Reels, 0.52% to 0.50% for carousels, and 0.35% to 0.33% for images, according to the previously cited benchmark reporting. These figures are reference points, not universal pass or fail thresholds. Your niche, audience quality, objective, and content mix still determine what a useful result looks like.
If you automate repetitive analysis, tools such as Claude Code social automation can be useful for teams that want to turn recurring data tasks into documented workflows. The important part isn't automation for its own sake. It's keeping the formula, date range, and content segments consistent.
For a practical formula reference, review this guide to the Instagram engagement rate formula.
Beyond Vanity Metrics, Measuring What Matters
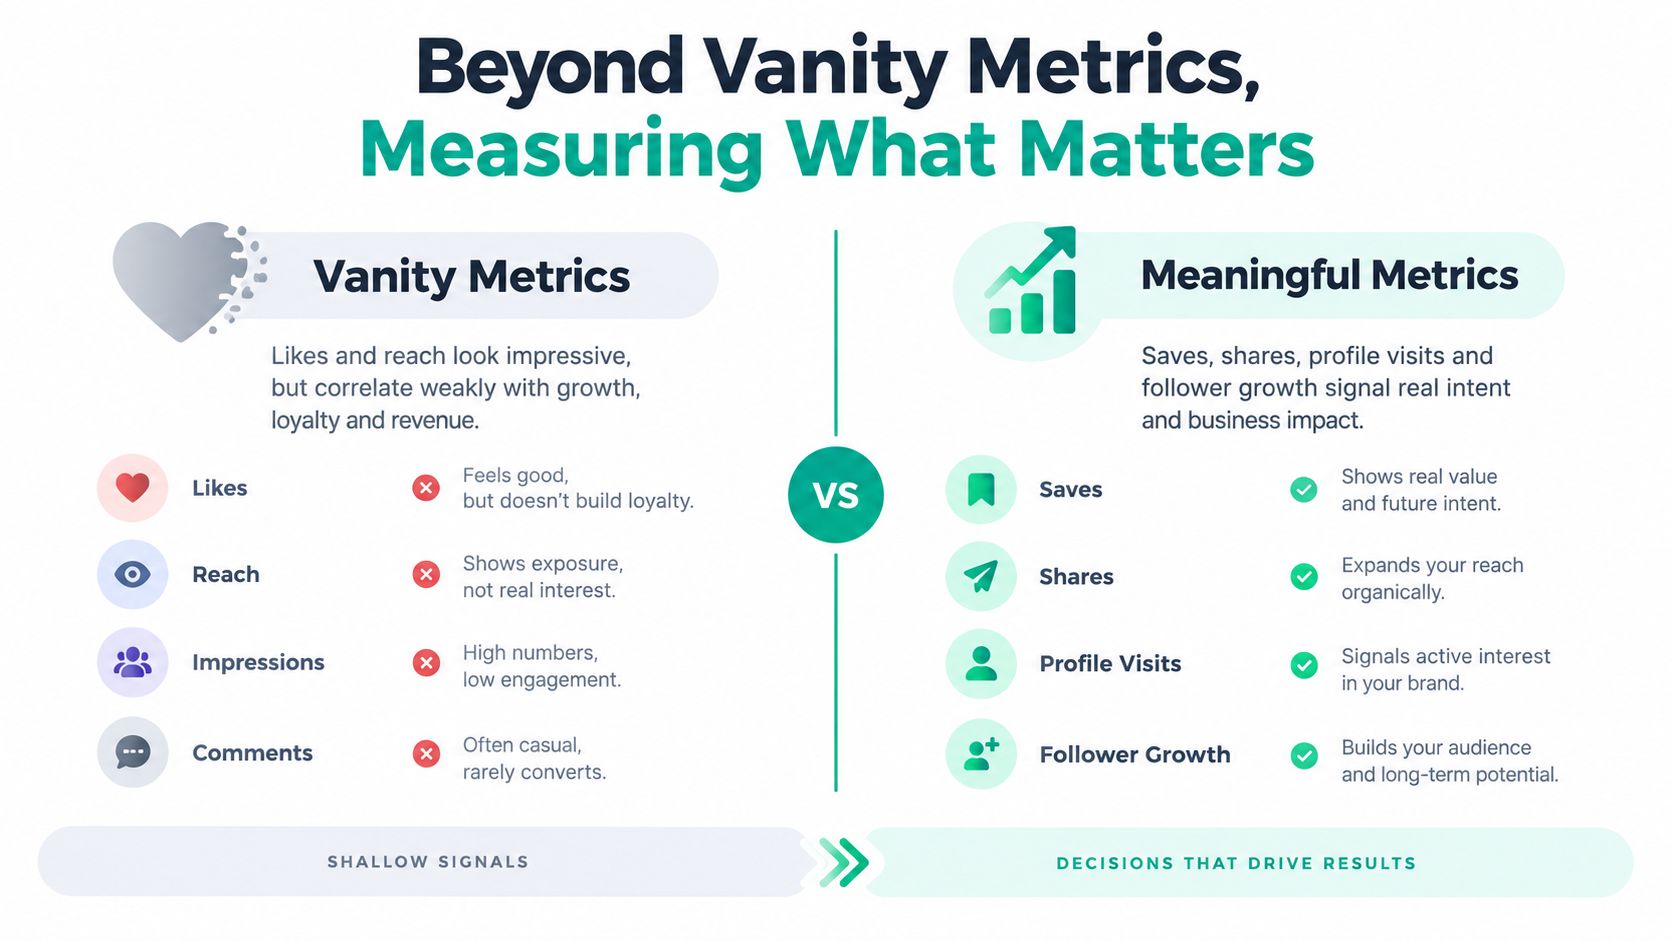
Likes and Reach are easy to screenshot, so teams often treat them as the headline. They're useful, but neither metric explains whether the audience found the content useful enough to revisit, recommend, or discuss.
A better report pairs surface activity with depth signals:
Saves: Did the content provide a reference people may need later?
Shares: Did the idea feel relevant enough to pass to another person?
Comment quality: Did people ask specific questions, explain their experience, or challenge the idea?
Profile visits: Did the post create enough interest to make someone investigate the account?
Follows: Did that investigation become an ongoing relationship?
Conversation is measurable intent
Metricool's 2026 study found that posts containing questions generated 36.7% more comments, while comment-focused calls to action drove 202.78% more comments. The same study reported that Story replies rose 88% year over year, whereas hashtags produced 31.7% fewer views and 33.89% fewer interactions, as detailed in this Metricool Instagram study.
Those findings point to a reporting gap. Public metrics don't capture every meaningful interaction, especially when people respond privately or use Stories to start a conversation. If your dashboard tracks only likes and reach, it may miss signs of trust and intent.
Use a diagnostic question
After every strong visible result, ask what happened underneath it. Did profile visits rise? Did the post earn saves or shares? Did comments contain real questions? Did followers increase after the exposure?
A post can be widely seen and still fail to create interest. Another can reach a smaller audience but generate the conversations that help a business understand objections, refine its offer, or build a stronger relationship. Report both breadth and depth before calling a result a win.
Turning Insights Into a Growth Workflow
Analytics becomes valuable when it creates a repeatable operating rhythm. You don't need a complicated dashboard to begin. You need a consistent review habit and a written connection between each observation and the next action.
Run a weekly content review
At the start of each week, review the previous week's posts, Stories, and Reels. Record the strongest and weakest examples, then write one sentence for each explaining what may have influenced the result.
Use a simple review sheet with these fields:
Content description: What did you publish?
Primary objective: Was it for discovery, education, conversation, or conversion?
Distribution result: How did Reach and Views compare with similar content?
Intent result: What happened with profile visits, follows, saves, shares, and comments?
Next test: What will you repeat, change, or stop?
Write hypotheses before you publish the follow-up. For example: “This Reel may have performed well because the opening states the audience's problem immediately.” After the next test, record whether the result supports that explanation. Don't confuse a repeated outcome with proof after one attempt. Look for a pattern across related posts.
Review strategy each month
A monthly review should look beyond individual posts. Check whether the audience is changing, whether the account is attracting the intended locations and demographics, and whether the content mix still reflects the business goal.
Keep paid and organic activity separate. A promoted post can receive distribution for reasons unrelated to the strength of its creative, so combining the two makes strategic interpretation harder.
For teams that want a repeatable method for analyzing trends, reproducible analysis with PlotStudio AI offers useful context for documenting how conclusions were reached. The same principle applies in a spreadsheet: preserve the input data, calculation method, interpretation, and resulting action.
Decision test: If a metric doesn't change what you publish, who you target, or how you allocate attention, it probably doesn't belong at the top of the report.
Use Instagram analytics tools when native reporting no longer gives your team enough structure or historical visibility. Choose a tool based on the gap you need to solve, such as reporting consistency, account management, trend comparison, or clearer client communication.
Finish every reporting cycle with five actions:
Keep: Identify the format or topic that deserves another test.
Change: Adjust one variable, such as the opening, structure, or call to action.
Stop: Remove a content pattern that repeatedly misses its intended objective.
Measure: Choose the metric that will determine whether the next test worked.
Document: Save the result and the reasoning so the team can build on it.
That workflow turns Instagram analytics insights into institutional knowledge. You're no longer reacting to whichever post has the biggest like count. You're building a record of what your audience notices, values, discusses, and acts on.
Gainsty offers an Instagram growth dashboard that tracks account activity such as follower gains, engagement-rate changes, and profile visits, helping you connect growth monitoring with the Instagram Insights workflow. Visit Gainsty to review how its analytics and account-management options could fit your reporting process.

.png&w=1920&q=75&dpl=dpl_2si4hWs7xtpQVmrY6d8xhJ1wLJZL)






.png&w=750&q=75&dpl=dpl_2si4hWs7xtpQVmrY6d8xhJ1wLJZL)