Why Instagram Engagement Metrics Feel So Confusing
A creator can publish a strong carousel and still see a dashboard that seems to disagree with itself. One post might attract plenty of likes, but few saves. Another may reach many non-followers, generate shares, and bring profile visits without producing a large comment count. A third may receive modest reach but convert viewers into followers efficiently.
The problem isn't that Instagram provides too little information. It's that the dashboard presents different signals without explaining which business or content decision each signal supports.
Three habits create most of the confusion:
Treating every number as equally important. A like and a profile visit are both interactions, but they show different levels of commitment. A profile visit means someone wanted to investigate the account behind the post.
Reading metrics in isolation. Reach without shares tells you little about distribution potential. Follows without profile visits may reflect broader account activity rather than one post. The numbers become useful when you connect them.
Comparing unrelated accounts. A Reel built for discovery, a carousel designed for saves, and a Story created to prompt replies shouldn't share the same success criteria. Audience size, geography, format, paid exposure, and niche all affect the result.
Instagram's global scale makes raw totals especially difficult to compare. Meta's advertising-planning tools, analyzed by DataReportal's Instagram statistics, estimated a potential advertising audience of 1.74 billion people in January 2025, equal to 21.3% of the world's total population. That audience expanded by 90.8 million people, or 5.5%, between January 2024 and January 2025, but it isn't the same thing as monthly active users. The figures describe potential advertising reach, not a universal engagement denominator.
Practical rule: Before asking whether a number is good, write down what it measures, who was exposed to the content, and which decision the number should inform.
The same discipline helps when engagement is meant to support lead generation. If a post attracts profile visits but your account doesn't make the next action obvious, the content may create attention without creating opportunity. A separate resource on Instagram lead generation can help connect audience activity with a clearer conversion path.
By the end of this guide, you'll have four useful tools: precise metric definitions, decision-specific formulas, context-aware comparisons, and a practical way to improve each stage of the audience journey.
The Core Instagram Engagement Metrics Explained
Think of your Instagram account as a shop on a busy street. Reach is the number of different people who walked past and saw the window. Impressions count how many times the window was viewed, including repeat looks from the same person. A passerby might glance twice, so impressions can be higher than reach.
That distinction matters because exposure isn't the same as response.
Interaction signals
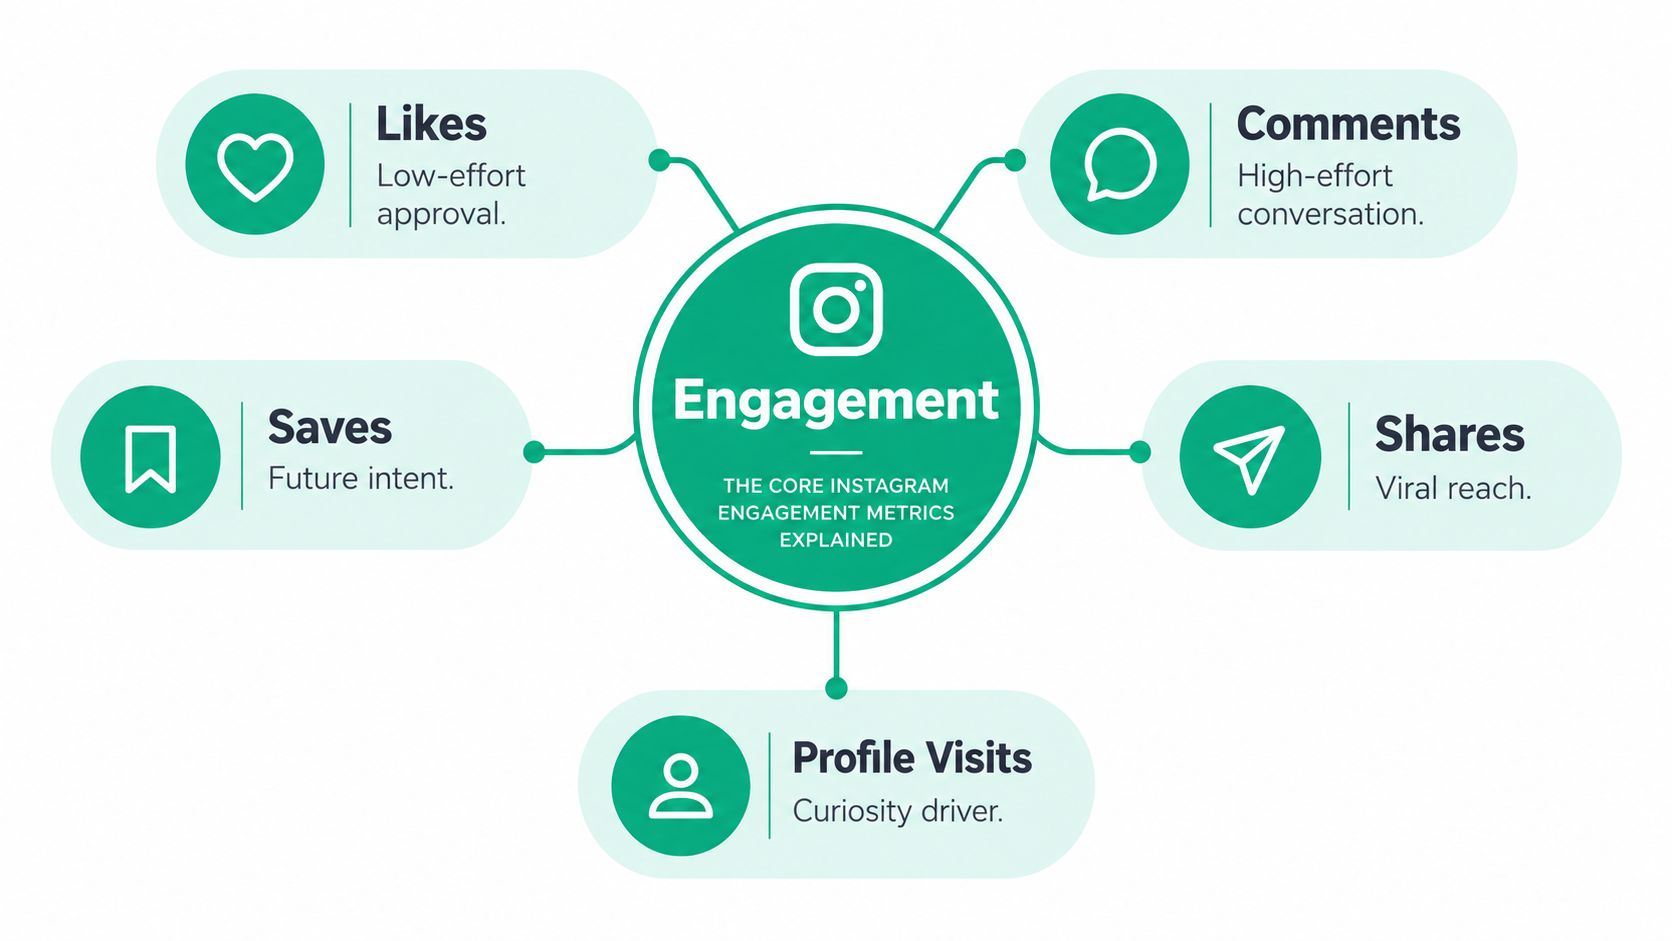
Likes are the lightest interaction. They show quick approval or recognition, but they require little effort and rarely explain why someone responded.
Comments require more attention. A thoughtful question, objection, personal story, or detailed answer gives you information about the audience's interests and language. Comment volume alone isn't enough, though. Ten relevant comments may teach you more than a larger number of one-word replies.
Shares move content beyond the original viewer's feed. A public share or private send can introduce your post to a new network, which makes sharing an important distribution signal. Treat shares as evidence that the content was useful, relatable, entertaining, or socially meaningful enough to pass along.
Saves indicate future intent. Someone saves a checklist, tutorial, comparison, or reference post because they expect to return to it. A save doesn't guarantee a later conversion, but it usually reflects stronger practical value than a quick like.
Exposure and outcome signals
Profile visits sit between exposure and conversion. They show that a viewer became curious about the account, creator, or business behind the content. If profile visits rise but follows remain flat, inspect your bio, pinned posts, profile image, and content promise.
Follows are an outcome signal. A follow means the viewer chose to keep receiving your content, but follower growth still needs context. A post can attract followers who aren't relevant to your niche, while a smaller post can attract a more appropriate audience.
Impressions count total content loads or views, including repeat exposure. They help you understand how often the content appeared, but they don't tell you whether unique people found it compelling.
Reach counts accounts exposed to the content. It's useful for judging distribution and for calculating how viewers responded after they saw the post.
Instagram reporting can also include video views, watch time, completion behavior, website taps, and other actions. Use those metrics when they match the format and objective rather than adding every available number to one score.
A useful filing system has three buckets:
Interaction signals: These describe how viewers responded, including likes, comments, saves, and shares.
Exposure signals: These describe how widely or repeatedly content appeared, including reach, impressions, and views.
Outcome signals: These describe what viewers did next, including profile visits, website taps, and follows.
For a wider treatment of engagement metrics for authentic brands, keep the same principle in mind: the metric is only meaningful when you connect it to the audience action you want to understand.
How to Calculate Engagement Rate the Right Way
Engagement rate is a relationship between interactions and an audience base. The formula looks simple:
Engagement rate = total interactions ÷ selected denominator × 100
The difficult part is selecting the denominator. Followers, reach, and impressions answer different questions, so they shouldn't be treated as interchangeable.
Choose the denominator by decision
Engagement by followers divides interactions by the account's follower count. It gives you a broad view of how actively the established audience responds, making it useful for tracking your own account over time. It can mislead when many followers didn't see the post or when the content reaches a large non-follower audience.
Engagement by reach divides interactions by accounts reached. It answers a more specific question: how did people respond after they saw this post? That makes it useful for comparing content effectiveness, especially when distribution varies from post to post.
Engagement by impressions divides interactions by total impressions. It can help when repeat exposure matters, such as content that appears several times in feeds or formats designed to build familiarity. Because one account may contribute multiple impressions, this rate describes response per exposure rather than response per unique account.
Instagram reporting systems may use different definitions for interactions and denominators. Hootsuite's Instagram metrics documentation also notes that some analytics breakdowns have eligibility requirements, including a minimum of 100 followers for certain audience and engagement-audience views, and that some third-party systems exclude collaboration posts. Document the formula and scope beside every rate.
Engagement by followers: Calculate interactions ÷ followers × 100. Use this for audience health and account-level trend reporting.
Engagement by reach: Calculate interactions ÷ accounts reached × 100. Use this for post resonance and content comparisons.
Engagement by impressions: Calculate interactions ÷ impressions × 100. Use this for response across repeated exposure.
Suppose a Reel has a known total of likes, comments, shares, and saves. You could divide that interaction total by reach to understand how strongly reached viewers responded, then divide the same numerator by followers to understand activation among the established audience. The two results may differ sharply without either being wrong.
Store the numerator and denominator separately in your spreadsheet. Label the formula, date range, format, audience segment, and whether paid distribution was included. That small documentation habit prevents you from comparing a reach-based post rate with a follower-based account rate and drawing the wrong conclusion.
The right engagement rate is the one that matches the decision you're making.
Instagram Engagement Benchmarks You Can Trust in 2025
A benchmark is a control point, not a verdict. It can show whether your result sits near a broader pattern, but it can't tell you whether the post supported your specific objective.
The verified benchmark data available for this guide covers format-level averages from Socialinsider. Its 2025 analysis reported approximately 0.55% average engagement for carousels, 0.52% for Reels, and 0.37% for single-image posts. Those figures come from an aggregate analysis and should not be treated as targets for every niche or account size. See the Instagram analytics business guide for additional guidance on connecting account data with content decisions.
Carousels: Approximately 0.55% average engagement. Use this as a reference point for educational or sequenced content.
Reels: Approximately 0.52% average engagement. Use this as a reference point for discovery-oriented video.
Single-image posts: Approximately 0.37% average engagement. Use this as a reference point for static visual content.
Stories: No verified benchmark is provided here, so compare against your own Story history.
Fashion: No verified niche benchmark is provided here, so segment your own audience and format data.
Food: No verified niche benchmark is provided here, so compare like with like.
Fitness: No verified niche benchmark is provided here, so use topic and format-specific history.
B2B: No verified niche benchmark is provided here, so avoid importing consumer-content expectations.
Nano accounts: No verified account-size benchmark is provided here, so use historical performance and reach context.
Large accounts: No verified account-size benchmark is provided here, so separate discovery from established-audience response.
The benchmark difference between carousels, Reels, and single images is useful because it supports a testing question: does format change the type or amount of response your audience gives? It doesn't prove that every account should publish more video. A carousel may suit saves and repeat reference, while a Reel may suit discovery and shares.
Run a controlled comparison instead of copying a benchmark:
Export your recent posts. Record format, topic, reach, impressions, interactions, profile visits, and follows.
Group comparable content. Compare carousels with carousels, Reels with Reels, and similar topics with each other.
Follow the direction. A steady improvement in saves, shares, or follows per reached account is more actionable than one unusually high post.
Audience composition also changes the baseline. DataReportal's United States digital audience analysis estimated Instagram's U.S. advertising audience at 172 million people in early 2025, with the audience representing different proportions of the total population, adults, and internet users. A U.S. adult campaign, an international creator account, and a niche professional account don't operate in the same audience environment.
Borrowed benchmarks age quickly. Your own historical data, recorded with a consistent formula and comparable content mix, is the most reliable yardstick for decisions about your account.
Why Likes Are the Weakest Signal for Organic Growth
Likes matter, but they're easy to overvalue because they're visible, familiar, and simple to compare. A person can like a post while moving quickly through the feed. That action confirms a moment of approval, but it doesn't reveal whether the content was useful enough to save, relevant enough to share, or compelling enough to investigate further.
A post with many likes and few saves may have broad appeal without lasting utility. A post with fewer likes but strong shares, profile visits, or follows may be doing more for organic growth.
Read the depth of the action
Comments usually require more effort than likes because the viewer has to formulate a response.
Saves indicate that the viewer expects future value.
Shares can introduce the content to people who weren't part of the original audience.
Profile visits show curiosity about the account, while follows show a decision to continue the relationship.
That doesn't mean you can assign a universal algorithmic value to each action. Instagram's distribution systems are complex, change over time, and depend on content quality, viewer behavior, relationships, and format. Avoid simplistic scoring systems that claim a like always equals one unit, a comment always equals another fixed amount, or a save always guarantees wider distribution.
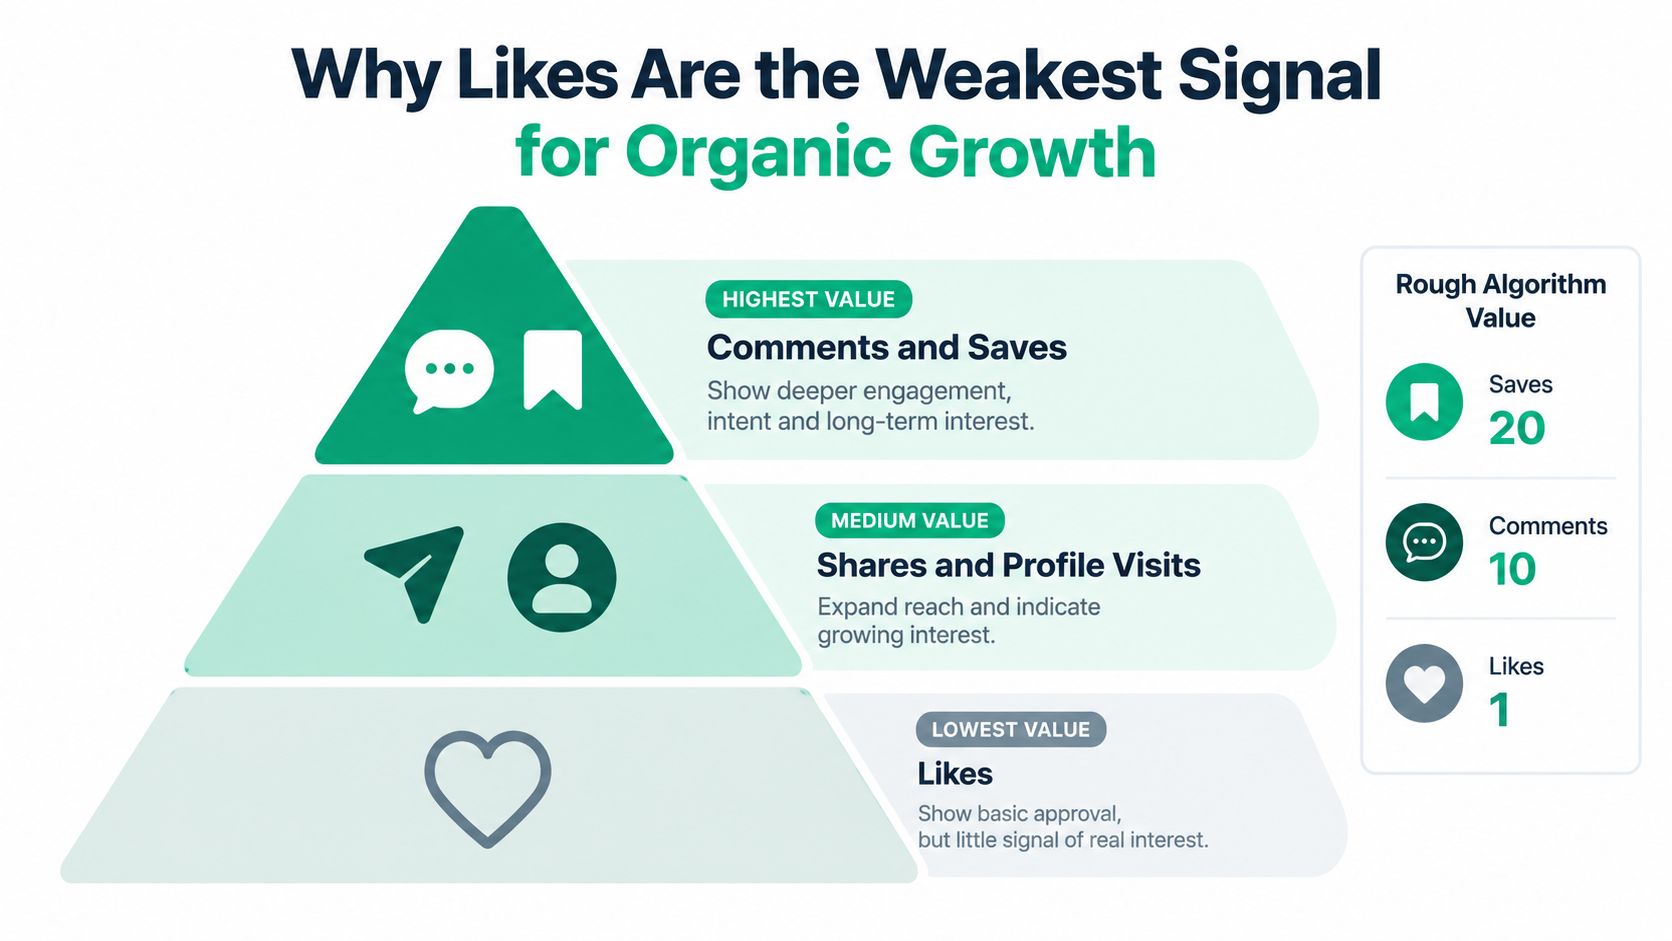
Instead, use a decision hierarchy. Ask what each action tells you:
Likes: Did the content earn immediate approval?
Comments: Did it create a conversation or surface a problem?
Saves: Did it provide reference value?
Shares: Did it earn enough relevance to travel?
Profile visits: Did it create curiosity about the account?
Follows: Did the account promise enough future value?
Share activity deserves close attention because it connects engagement with distribution. A Socialinsider benchmark of 2,967 global companies reported that average shares per post rose 86% over six months, making shares an increasingly important signal to include in reporting. The finding doesn't mean every share creates durable growth. It means you should examine whether shared content also produces profile visits, follows, repeat viewers, or business actions.
Review your last posts and sort them by shares, saves, profile visits, and follows per reached account, not just likes. Then identify the topics and formats that repeatedly produce deeper actions. You're not rejecting likes. You're giving them the right role, as an early approval signal rather than the final measure of organic value.
How to Improve Each Instagram Engagement Metric
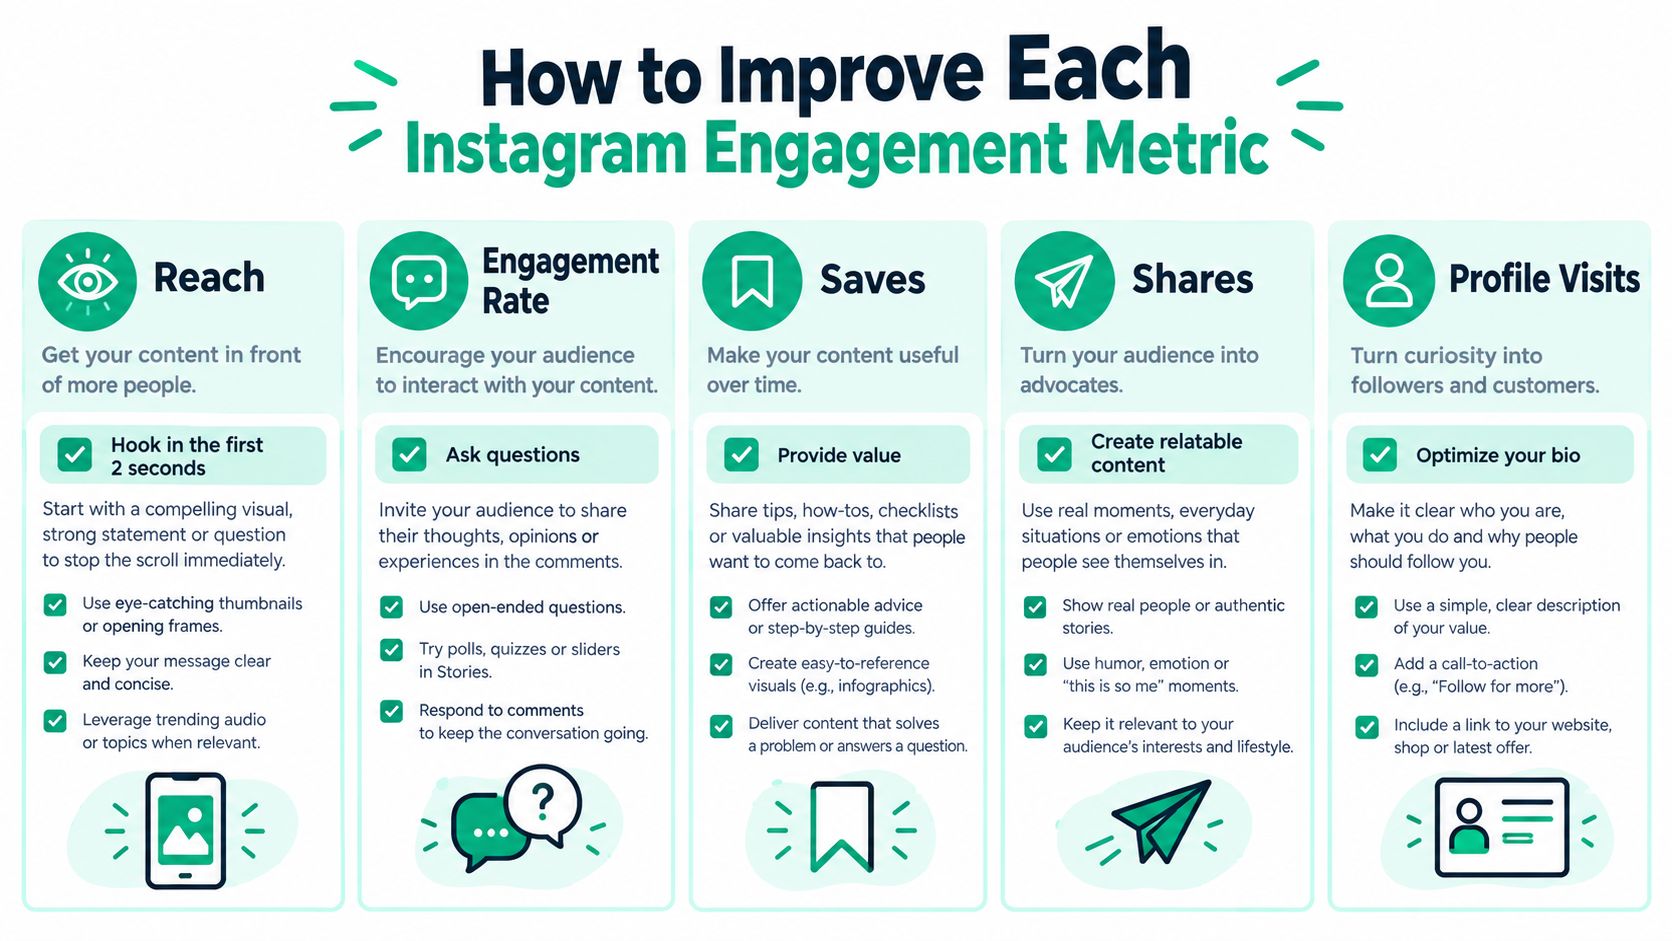
Improvement starts with diagnosis. Don't change your entire content strategy because one number is weak. Identify the stage that causes the highest drop-off, then adjust the content element most likely to improve that stage.
Match the tactic to the metric
Reach depends on whether people stop and whether the content can travel beyond the existing audience. Test a clear opening in the first moments of a Reel, use a topic that matches your niche, and make the first frame understandable without sound. These changes take creative effort, but they can improve the chance that unfamiliar viewers keep watching.
Impressions often increase when content earns repeat exposure. Reshare useful posts to Stories, build carousels that encourage movement through several slides, and create series that give viewers a reason to return. The cost is consistency, not just publishing more.
Likes respond to immediate clarity. Use a clean visual, one obvious idea, and a caption that makes the value of the post easy to understand. Likes are useful as a quick feedback signal, but don't make them the only target.
Comments need a specific invitation. Ask which option the viewer would choose, request an experience related to the topic, or present a narrow problem with more than one reasonable answer. Reply thoughtfully and use recurring questions to shape future content.
Saves grow when the post solves a future problem. Try step-by-step frameworks, checklists, comparison posts, definitions, and referenceable lists. A save-oriented post needs enough structure to remain useful after the viewer leaves the feed.
Shares come from relevance. Create a concise insight someone would send to a colleague, a relatable situation that reflects the audience's experience, or an explanation that helps one person support another. Don't rely on “tag a friend” prompts unless the content gives people a genuine reason to share.
Profile visits and follows depend on message continuity. Make your bio state who the account serves and what it publishes, pin posts that explain your perspective, and organize Highlights around the questions a new visitor is likely to ask. If profile visits rise but follows don't, the problem may sit on the profile rather than in the post.
Short-form video often contains the clues you need. Transcribing Instagram videos with a tool such as Scribiz's Instagram video transcript service can help you review hooks, repeated phrases, questions, and calls to action across your own content.
Use this seven-day audit:
Collect recent posts: Record format, topic, reach, impressions, likes, comments, saves, shares, profile visits, and follows.
Label the objective: Mark each post as discovery, conversation, reference value, or conversion support.
Calculate consistent rates: Use the same denominator within each comparison group.
Find the leak: Identify whether exposure, interaction, profile action, or follow conversion is weakest.
Review the creative: Compare hooks, opening frames, structure, captions, and calls to action.
Choose one test: Change one variable, such as format, topic angle, or opening.
Record the result: Review the next group of comparable posts before making another major change.
For more practical ideas, compare your findings with this guide on increasing Instagram engagement organically. The useful outcome isn't a busier dashboard. It's a clearer link between one content decision and one audience response.
Building a Simple Measurement System for Sustainable Growth
Sustainable measurement follows the audience through four stages:
Exposure: Reach and impressions show whether people encountered the content.
Interaction: Likes, comments, saves, and shares show how they responded.
Profile action: Profile visits and website taps show whether attention moved deeper.
Conversion: Follows, enquiries, purchases, or another defined outcome show whether the attention supported the account's goal.
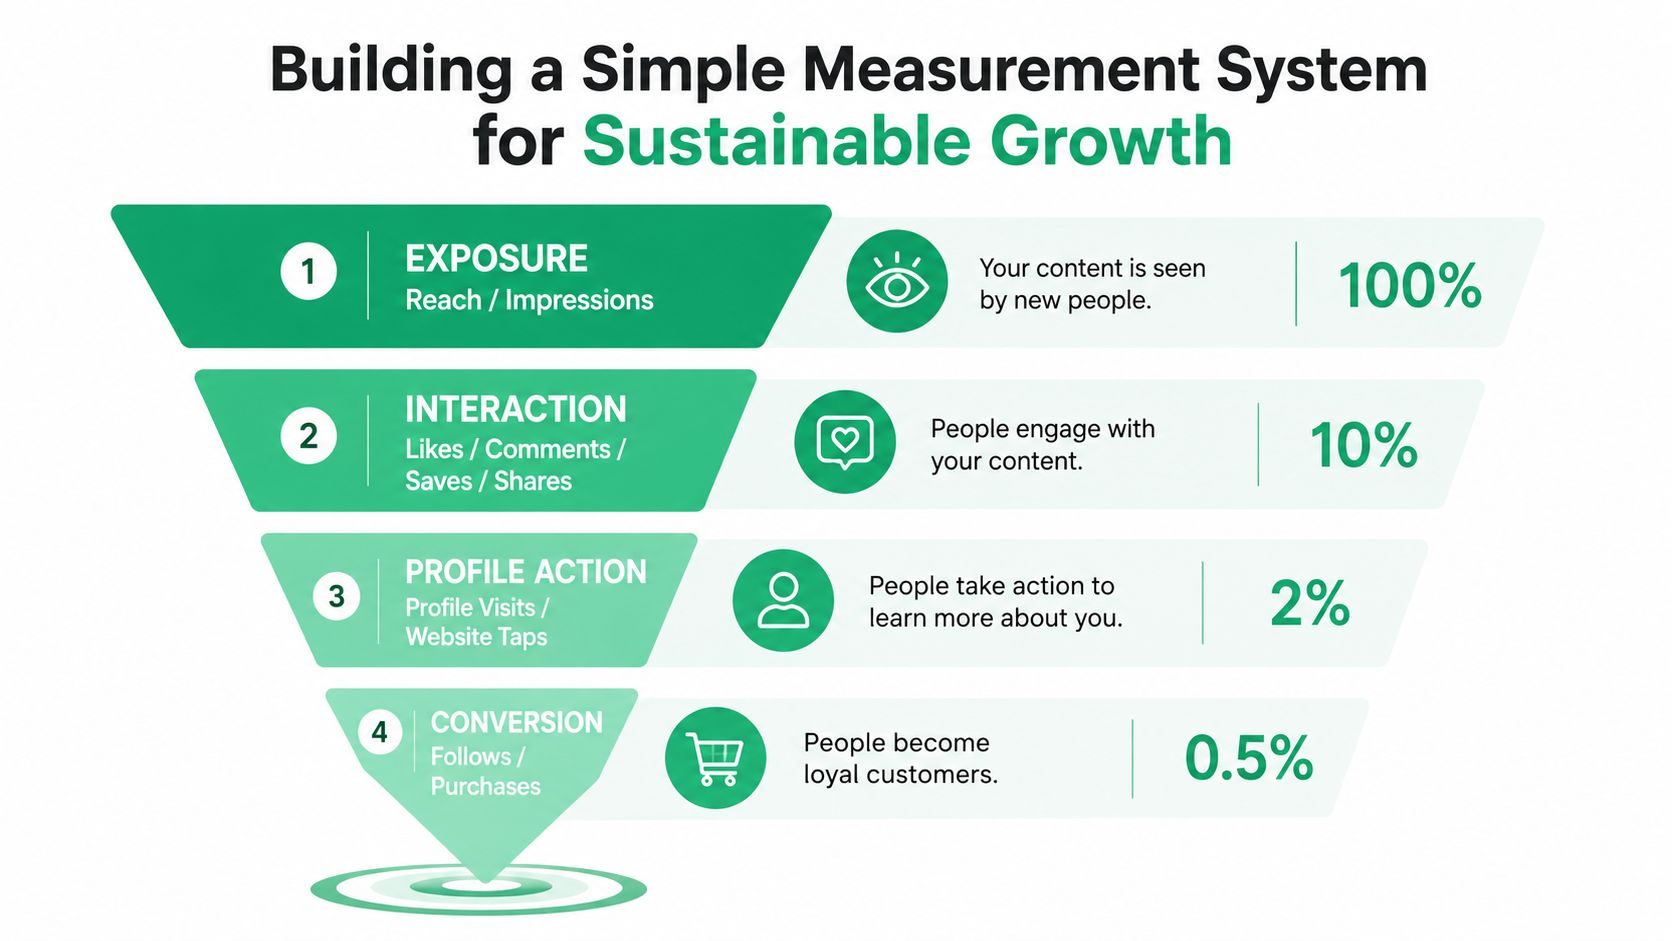
Review post-level exposure and interaction weekly so you can spot changes in format or topic while the details are still easy to remember. Review profile actions and follower movement over a longer period, because a post may create curiosity before the viewer decides to follow or visit a website.
A simple spreadsheet can contain one row per post and these columns:
Exposure: Record reach, impressions, format, and topic. Ask: Did distribution change?
Interaction: Record likes, comments, saves, and shares. Calculate total interactions ÷ selected denominator.
Profile action: Record profile visits and website taps. Calculate profile actions ÷ reach.
Follow conversion: Record follows attributed to the period. Calculate follows ÷ profile visits when the data scope matches.
Business outcome: Record enquiries, sales, or another goal. Calculate outcome ÷ relevant action.
Keep the numerator and denominator visible. If engagement by reach falls, check whether the content resonated less or whether the post reached a broader, colder audience. If profile visits rise while follows fall, review the account promise. If shares increase but later profile activity doesn't, the post may have generated temporary distribution without attracting the right audience.
Instagram's native reporting has limits for long-term attribution. Sprout Social's discussion of Instagram Insights notes that key account-level views such as accounts reached and accounts engaged are commonly limited to roughly 90 days, while built-in competitor benchmarking and year-over-year comparison are not available in the same way. Preserve regular exports, tag content by topic and format, and compare later profile visits, follows, repeat views, and conversions with the posts that first generated attention.
A guide to Instagram analytics tools can help you evaluate reporting workflows, but no tool replaces a clearly defined denominator and a fixed review cadence. Consistent measurement beats chasing one viral post because it shows which audience responses repeat.
Gainsty provides Instagram analytics guidance and organic growth support for creators, businesses, and brands, including tracking for reach, impressions, interactions, and engagement rate. Visit Gainsty to explore a measurement-led approach that connects content performance with sustainable Instagram growth.

.png&w=1920&q=75&dpl=dpl_2si4hWs7xtpQVmrY6d8xhJ1wLJZL)






.png&w=750&q=75&dpl=dpl_2si4hWs7xtpQVmrY6d8xhJ1wLJZL)