Why Most Social Media Reports End Up Ignored
Moving Beyond Vanity Metrics
Successful brands are moving past pretty charts and focusing on what the data is telling them. They're building narratives around the numbers, explaining the "why" behind the trends and connecting social media activity to real business outcomes. This means ditching the generic social media analytics report template and creating one that truly speaks to your stakeholders.
This shift towards data storytelling is essential. Context is always more valuable than raw numbers. It’s the difference between a report that gathers dust and one that generates meaningful discussions and drives real strategic change.
The Metrics That Move The Needle
Forget vanity metrics. Let’s talk about the numbers that genuinely impact your bottom line. In my experience, focusing on the right Key Performance Indicators (KPIs) is the difference between a report that gathers dust and one that drives real change. Whether you're selling products online or working in B2B, your social media analytics report template needs to prioritize metrics tied to your specific business goals.
For e-commerce, that means tracking sales attribution. Which platforms are leading to purchases? How are different campaigns contributing to revenue? Understanding what content clicks with your audience is key. Need some content inspiration? Check out these social media post ideas.
B2B? It’s all about lead quality and pipeline contribution. Are your social media efforts generating qualified leads that turn into opportunities? How is social media impacting your sales pipeline? These are the questions your report should answer.
Engagement That Matters
Engagement is important, but it's not all created equal. Likes and comments are great, but they don't always translate into tangible results. Instead of focusing on vanity metrics, look at the engagement signals that predict future performance.
Think share rate, click-through rate, and conversion rate. These are much better indicators of how your content is resonating and driving action. Want to dig deeper into growth? Read also: Social Media Growth Strategies.
Also, keep an eye out for early warning signs of declining performance. Are your engagement rates dropping? Is your reach shrinking? These are signals you might need to tweak your strategy.
Connecting Social to Revenue
One of the toughest challenges in social media reporting is connecting activity to revenue. It’s not always a straight line. But with the right approach, you can show the ROI of your social media work.
Start by mapping out your customer journey, highlighting where social media plays a role. Then, track the metrics that reflect those touchpoints, like website traffic from social, leads generated from social, and ultimately, sales attributed to social media.
Speaking of growth, the social media analytics market is expected to boom. Experts are predicting a 25.2% CAGR from 2025 to 2032, reaching nearly $107.02 billion! Learn more about the Social Media Analytics Market here. This just goes to show how important it is to invest in solid analytics and reporting. Don’t just track the data – use it to make smart decisions that drive real business growth.

Designing Reports People Want To Read

Creating a truly effective social media analytics report template isn't about throwing in every possible metric. It's about creating something people find useful. Think about it – even the most brilliant data is worthless if it's buried in a dense, impossible-to-read document. Knowing which metrics matter most often comes from understanding your competition. Social media competitor analysis can be a lifesaver here.
Visual Hierarchy: Guiding the Reader’s Eye
This is where visual hierarchy becomes so important. You want to lead with your most impactful insights. Think of your report like a newspaper – the headline grabs you, then the subheadings, and then the details. Your social media analytics report template should work the same way.
Start with a concise executive summary that focuses on the business impact of your social media work. Did your last campaign generate a 15% increase in leads? Did brand awareness jump by 10%? Highlight those wins first, then back them up with the data.
For example, instead of leading with "Engagement increased by 20%," try something like, "Our boost in engagement drove a 10% lift in website traffic, resulting in X new leads." See how that reframes the information? Business impact first, metrics second.
Tailoring Your Template for Different Audiences
Reporting isn’t one-size-fits-all. Your C-suite cares about different things than your social media manager. That's why a flexible, customizable template is so crucial. Thinking about the audience is important for all kinds of content, like when you're creating a social media content calendar.
You can adapt a single core social media analytics report template for different stakeholders simply by rearranging sections and tweaking the detail level. For the C-suite, keep it high-level, focusing on overall trends and ROI. For marketing managers, go deeper into campaign performance and core metrics. And for social media managers, you can get granular with individual post performance.
This lets you maintain a consistent reporting structure while delivering the most relevant information to each audience, without creating a ton of extra work. It's all about efficiency!
To help you visualize this, take a look at the list below:
Report Section Priority Matrix: A comparison of which report sections different stakeholders prioritize most, helping you structure your template effectively.
The Executive Summary, which outlines the overall business impact, is of high priority to the C-suite, medium priority to marketing managers, and low priority to social media managers. It is recommended to place this section first in the report.
The Campaign Performance Overview, detailing key metrics and ROI, holds medium priority for the C-suite, high priority for marketing managers, and medium priority for social media managers. This section is best placed second in the report.
The Individual Post Performance section, which includes granular data and insights, is of low priority to the C-suite, medium priority to marketing managers, and high priority to social media managers. This section is recommended to be placed third.
Competitive Analysis, covering industry benchmarks and trends, is of medium priority for both the C-suite and social media managers, and high priority for marketing managers. It should appear fourth in the report.
The Platform-Specific Deep Dives, which provide detailed channel performance, are of low priority to the C-suite, medium priority to marketing managers, and high priority to social media managers. This section is best placed fifth.
As you can see, understanding priorities helps you structure your report effectively. Leading with the C-suite's key concerns (overall business impact) and then progressively providing more granular detail ensures everyone gets the information they need. This structure allows for a flexible, adaptable template that caters to all stakeholders.
Building Your Template From Scratch
Let's talk about building a social media analytics report template that works for you. Think of it like a house: you wouldn't build one without a blueprint. Your template is your blueprint, guiding you from raw data to killer insights. I've seen how the right template can take a mess of numbers and change them into a powerful story.
This infographic shows the key steps: data extraction, visualization, and report generation. It’s a simple but effective flow.
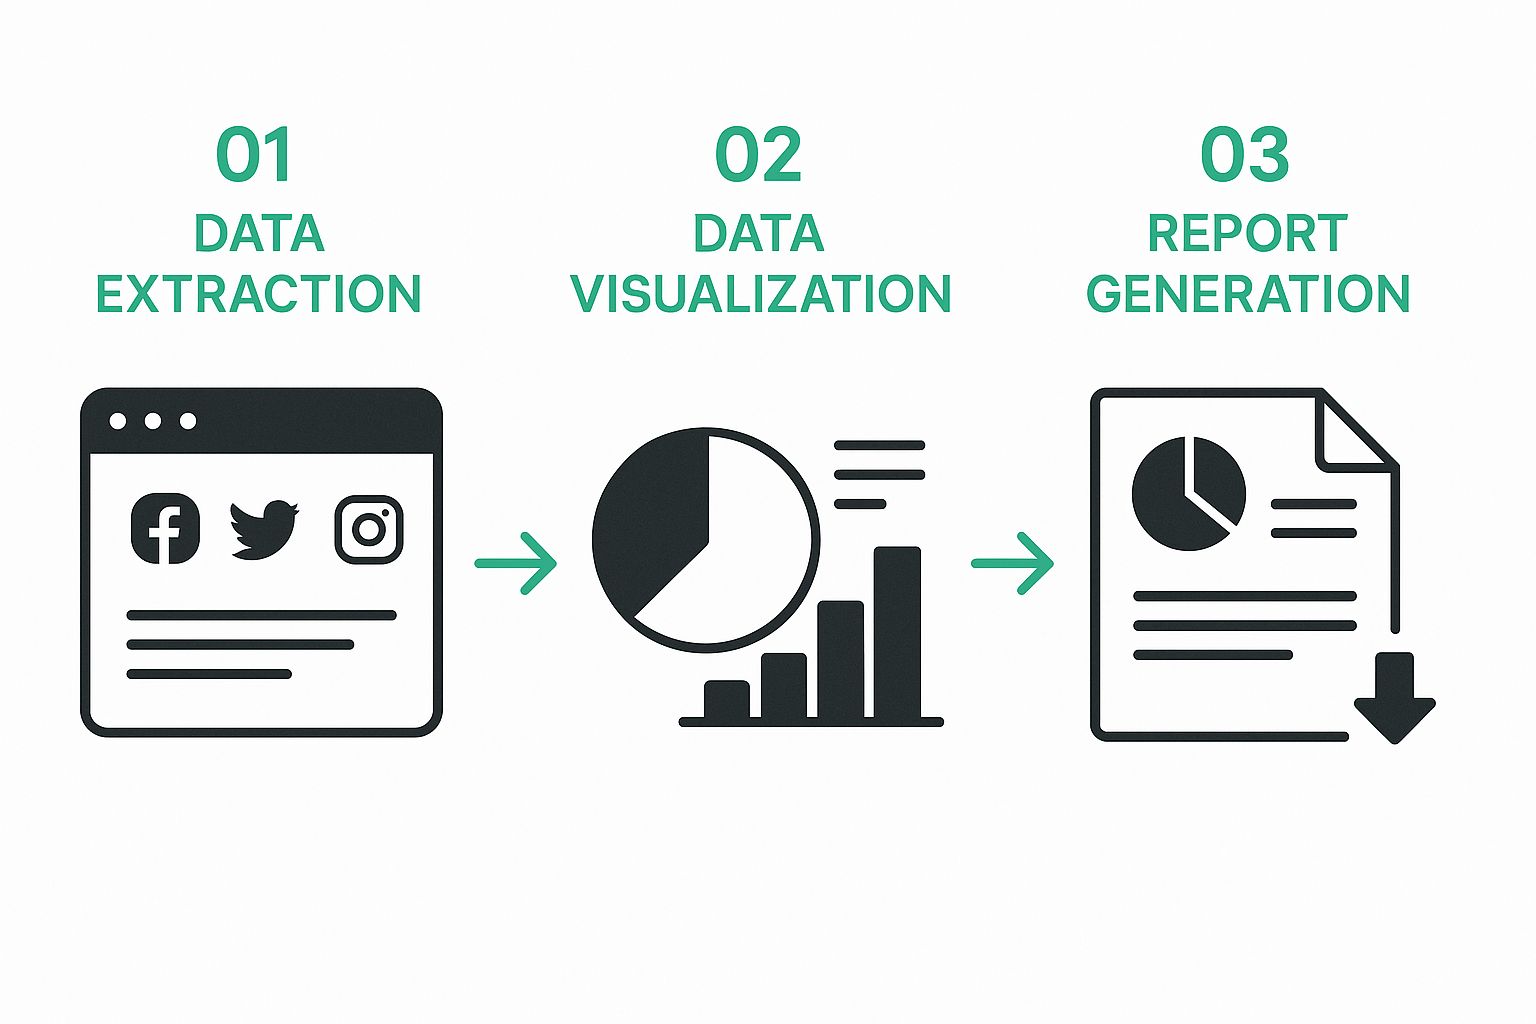
This process takes raw data from all your social platforms and turns it into easy-to-understand visuals. These visuals then become the foundation of your report. By the way, did you know that the social media analytics market is booming? North America currently holds a 33.0% market share, and the global market is expected to explode from $14.0 billion in 2024 to $83.11 billion by 2033! Pretty wild, right? Check out more stats here.
Structuring For Success
Don't just throw data into a spreadsheet and call it a day. Think about telling a story. Start with an Executive Dashboard highlighting the most important metrics. Not every number, just the ones that truly matter to your stakeholders. It's like a highlight reel of your social media performance.
Then, dive deeper with Metric Breakdowns. Here's where you provide context and detail behind those key numbers. A good template balances the high-level overview with the granular details, giving everyone from the CEO to the social media manager what they need.
Automating your data collection is a game-changer. Tools like Google Sheets are great for this. See the example below:

With Google Sheets, you can pull data directly from different sources, automate calculations, and build dynamic charts and graphs. This automation not only saves you time, but it also reduces the risk of manual errors, letting you focus on the real work: analysis.
Automating Data Collection
But remember, automation shouldn't replace human insights. It's about freeing you up to focus on the why behind the data. What's the story your metrics are telling? What actions should you take based on what you're seeing? That's what makes a report valuable.
Here's a pro tip: Use conditional formatting to automatically highlight big changes or unusual patterns. It’s a huge time-saver and immediately draws your attention to areas that need a closer look. It's like having a digital assistant flagging the most important stuff for you.
Advanced Features That Set Your Reports Apart
Want to create social media analytics report templates that truly stand out? You know, the kind that stakeholders want to read? This section dives into the advanced features that can elevate your reports from basic data dumps to invaluable strategic tools.
Predictive Indicators: Forecasting Future Performance
Think about how helpful it would be to anticipate performance trends before your competitors even catch a whiff. That's the potential of predictive indicators. By incorporating elements like trend lines, moving averages, and even simple forecasting models into your templates, you can provide a sneak peek into the future. This gives stakeholders a valuable head start in adjusting strategies and grabbing new opportunities.
For example, imagine spotting a steady upward trend in engagement for a particular type of content. Your template could then extrapolate that trend to project future performance, enabling proactive content planning and smarter resource allocation. It's like having a crystal ball (without the cheesy mystical vibes).
Competitive Benchmarking and Attribution Modeling
Knowing your competitors is crucial for staying ahead. Including competitive benchmarking data in your reports provides crucial context for your performance. Adding cross-platform attribution modeling unveils the full customer journey, revealing how each social media channel contributes to conversions.
This means you can see which competitors are making waves, where you’re outperforming them, and where you could improve. Grasping the complete customer journey also helps you allocate budget and resources more effectively.
Advanced Segmentation and Calculated Fields
Looking for hidden insights in your data? Advanced segmentation allows you to slice and dice your audience data in countless ways. This lets you pinpoint segments responding well to your campaigns and discover opportunities for more targeted messaging. I’ve personally seen this uncover game-changing insights for clients.
Creating custom calculated fields within your templates lets you go beyond standard metrics. You can create calculations specific to your business goals, giving you a deeper understanding of what’s driving performance. Maybe you want to calculate the cost per lead from a specific campaign? Custom calculated fields can do that.
Automated Alerts and Dynamic Date Ranges
Don’t wait for problems to smack you in the face – set up automated alerts. These will ping you when significant performance changes happen, letting you act fast and stop small issues from becoming major headaches.
Also, using dynamic date ranges in your templates ensures your reports always reflect the correct period—no more manual updates! You can set your template to automatically pull data for the past week, month, or quarter, based on your reporting schedule. This saves you a ton of time and minimizes errors. It's a small change that has a huge impact.
To illustrate the potential of some of these advanced features, let’s take a look at the following comparison list:
Advanced Template Features Comparison
This list compares various advanced features available in different analytics platforms, highlighting their implementation difficulty, business impact, ideal use cases, and estimated time investment.
Predictive Indicators have a medium implementation difficulty and deliver a high business impact. They are best suited for strategic planning and content optimization, requiring a moderate time investment.
Competitive Benchmarking is easy to implement and provides a medium level of business impact. It is ideal for performance analysis and competitor research, with a low time investment.
Attribution Modeling is hard to implement but yields a high business impact. It is most useful for budget allocation and channel optimization, and it demands a high time investment.
Advanced Segmentation has a medium implementation difficulty and results in high business impact. It is valuable for targeted messaging and campaign optimization, requiring a moderate time investment.
Calculated Fields are easy to implement and offer a medium business impact. They are best for custom reporting and performance tracking, with a low time investment required.
Automated Alerts are also easy to implement and provide a high business impact. They are beneficial for real-time monitoring and issue prevention, needing only a low time investment.
Dynamic Date Ranges are easy to implement and deliver a medium business impact. They support report automation and time saving, with a low time investment.
As you can see, even features that are relatively easy to implement can have a significant positive impact on your business. Investing time in setting up these features can streamline your reporting process and unlock more actionable insights.
Getting Your Reports Read And Acted Upon

A beautifully designed social media analytics report template is worthless if nobody reads it. It’s like crafting a gourmet meal only to let it go to waste. The real magic happens when your insights reach the decision-makers and, even better, when they take action.
Distribution Strategies for Maximum Impact
Consider how your reports are shared. Are they buried in email threads or lost on shared drives? In my experience, successful teams leverage automated distribution tools. This ensures the right data gets to the right people at the right time. Think scheduled, personalized email summaries for different stakeholders, or using project management platforms like Asana or Monday.com to assign action items directly from the report.
For instance, the marketing manager might receive a deep dive into campaign performance, while the CEO gets a high-level overview of the overall ROI. Automating this not only saves time but also ensures consistent delivery and follow-up.
Building Accountability: From Insights to Action
Distribution is the first hurdle. Next comes accountability. Your report template should include clear action items linked to your insights. Don’t just report the numbers; explain what they mean and what should be done about them.
This might involve adding a separate tab in your template to track these action items, assign owners, and set deadlines. I've found that using simple checkboxes and color-coding can visually track progress and keep everyone aligned. Want to delve deeper into measuring your social media success? Check out this guide on how to Measure Social Media Success.
Also, think about adding performance improvement planning to your reporting. This involves creating specific, measurable, achievable, relevant, and time-bound (SMART) goals. Tracking these goals over time shows the real-world impact of your social media efforts and focuses everyone on continuous improvement.
Real-World Examples: Collaboration and Alignment
I’ve seen firsthand how effective reporting can change a company’s trajectory. One client, a growing e-commerce brand, struggled to connect their social media activities with their bigger business goals. Their report template was decent, but mainly for internal use and rarely shared.
We helped them revamp their reporting, including automated distribution, clear action items, and performance improvement plans. The result? A huge shift. Their reports became a catalyst for cross-departmental collaboration. Sales started using social media insights to identify new leads, product development used audience feedback to refine products, and the executive team finally grasped the true value of social media.
This strategic alignment is the ultimate aim of any reporting system. It's about moving beyond just measuring performance and using the data to make smart decisions and achieve company-wide goals. It's about making your reports a living document that guides strategy, fosters collaboration, and ultimately, contributes to the bottom line.
Your Implementation Roadmap
Creating a killer social media analytics report template isn't something you just do once and forget about. It's more like tending a garden. You plant the seeds (your initial template), nurture them (by gathering data), and then prune and adjust as they grow (by refining your reporting). It’s an ongoing process of building, testing, and refining. The goal isn't instant perfection, but a system that evolves alongside your business.
Testing and Feedback: The Dynamic Duo
After you’ve built your template, don’t just throw it at your stakeholders. Start with a testing phase. Run some sample reports, double-check the data for accuracy, and make sure the layout is clear and easy to understand. I’ve learned from experience that a fresh pair of eyes can often catch mistakes you might miss, so grab a colleague and ask them to take a look.
Next, it's time for stakeholder feedback. Don't shy away from asking direct questions: What information do they find most valuable? What's missing? What could be presented more clearly? Their input is gold when it comes to making your reports truly relevant. This is where a casual, conversational approach shines. A quick chat can often uncover insights that a formal survey might miss.
Iterative Improvements: The Key to Long-Term Value
Using the feedback you’ve gathered, start making iterative improvements to your template. This might mean adjusting the layout, incorporating new metrics, or streamlining existing sections. Remember, reporting is a dynamic process. Your template should be a living document, constantly adapting to your changing needs and priorities. I once had a client whose report I completely overhauled after realizing it wasn't aligned with their core business goals. It was a big change, but it dramatically improved how they used the data.
Measuring Effectiveness and Future-Proofing
How do you know if your reports are making a difference? Measure their impact. Are stakeholders using the information to inform their decisions? Has it improved team collaboration? Is it contributing to overall business goals? Tracking the impact of your reports helps justify the time and resources you invest in them.
Finally, the social media world is in constant motion. Future-proof your template by keeping up with new platforms, features, and best practices. This might mean adding new sections, integrating new metrics, or even exploring new visualization techniques. It's all about remaining flexible and adaptable in an environment that never sits still.
Ready to change your Instagram followers with authentic, organic growth? Gainsty's AI-powered social assistant is your solution. Boost your Instagram with Gainsty today!

.png&w=1920&q=75&dpl=dpl_CMMfGpbQuhx6dFHcgd2LtxhhEMrL)


.png&w=750&q=75&dpl=dpl_CMMfGpbQuhx6dFHcgd2LtxhhEMrL)