Why Engagement Is Your Most Valuable Metric
Let's be real for a second: a huge follower count looks great on paper, but it doesn't pay the bills. Too many marketers get caught up chasing a big audience, only to find their posts are met with crickets. This is what we call a vanity metric—a number that feels good but does absolutely nothing for your actual business goals. The real currency on social media is active engagement.
A high engagement rate tells you a few powerful things. First, it signals to the social media algorithms that your content is valuable, which means they'll show it to more people. That's how you expand your reach organically. Second, it proves you have a real connection with your audience, which is how you build brand loyalty and turn casual followers into genuine fans. That connection is what ultimately drives conversions, whether you're trying to make sales, get leads, or just build up your brand's reputation.
Navigating a Crowded Digital World
Being able to measure what works has never been more important. The online world is incredibly noisy, making it a constant battle to grab and hold your audience's attention.
In a world where attention is the new currency, engagement is the ultimate measure of value. An engaged audience is one that listens, trusts, and ultimately, acts. Without it, you're just shouting into the void.
This is precisely why a social media engagement calculator is such a critical tool. It helps you cut through all that noise and gives you clear, actionable data on what your followers actually care about. When you start tracking this key performance indicator, you can:
Pinpoint Winning Content: Figure out exactly which post formats, topics, and creative styles get people talking.
Refine Your Strategy: Stop guessing what might work and start making data-driven decisions about your content calendar.
Build a Stronger Community: Get a real feel for what matters to your audience, so you can create content that sparks genuine conversation.
Understanding the Scale of Social Media
The sheer number of people on these platforms really puts into perspective why engagement is a much better metric than reach alone. As of October 2025, there are an estimated 5.66 billion social media user identities across the globe. A staggering 93.8% of all internet users are active on these platforms every single month.
This massive user base means your potential reach is practically limitless, but it also means just being seen isn't enough to make a dent. You have to track likes, shares, and comments to know if your message is actually landing. You can dive into a full breakdown of these global social media trends to see just how vast the landscape is. Focusing on engagement ensures your efforts are building a real connection, not just getting lost in the crowd.
Unpacking the Engagement Rate Formulas
The math behind social media engagement can seem intimidating, but once you get the hang of it, the core concepts are surprisingly simple. There isn't just one "right" way to calculate it; different formulas tell different parts of your content's story. The key is picking the one that aligns with what you're actually trying to measure.
Are you looking at how a single post performed with the audience that actually saw it? Or are you more interested in the overall health of your account and how consistently your followers are interacting? Each goal needs a slightly different approach.
Engagement Rate by Reach (ERR)
If you want the unvarnished truth about a single post's performance, Engagement Rate by Reach (ERR) is your go-to metric. I find it’s one of the most honest measures out there.
The formula is: (Total Engagements on a Post / Reach of that Post) x 100
ERR shows you the percentage of people who saw your content and were moved enough to actually do something—like, comment, share, or save. Its power comes from the fact that it isn't watered down by your total follower count. It only cares about the unique individuals who laid eyes on that post.
Let's say an Instagram Reel was seen by 10,000 people and racked up 800 engagements. Your ERR would be a solid 8%. That gives you a crystal-clear picture of how compelling that one piece of content was.
The only real catch? Reach can be all over the place. A viral post might have a massive reach, but the ERR could be lower than a post shown to a smaller, hyper-engaged slice of your audience.
Engagement Rate by Post (ER Post)
This one is a classic for good reason. It measures engagement on a single post against your total follower count, which makes it a fantastic tool for tracking how your content performs over time.
Here's the formula for Engagement Rate by Post (ER Post): (Total Engagements on a Post / Total Followers) x 100
So, if you have 20,000 followers and a post gets 1,000 engagements, your ER Post is 5%. Because your follower count is generally more stable than post reach, this calculation gives you a reliable benchmark. You can easily compare posts against each other and answer the question, "Are my followers paying attention?"
My Take: ER Post is perfect for tracking the consistent performance of your content relative to your audience size. ERR, on the other hand, is what you use to judge how effective an individual piece of content was at turning viewers into active participants.
This little distinction is what separates growing a real, invested community from just collecting empty follower numbers.
This visual really drives home the point: are you building a community or just chasing vanity metrics? Ultimately, the infographic highlights that genuine success is rooted in real interaction, not just a big follower count.
Picking the right formula is the first step toward getting insights you can actually use. For a more detailed look at platform specifics, this guide on the Instagram engagement rate formula is a great resource. And to see these ideas in a real-world context, learning how to calculate and boost your TikTok engagement rates can show you how to put these formulas to work.
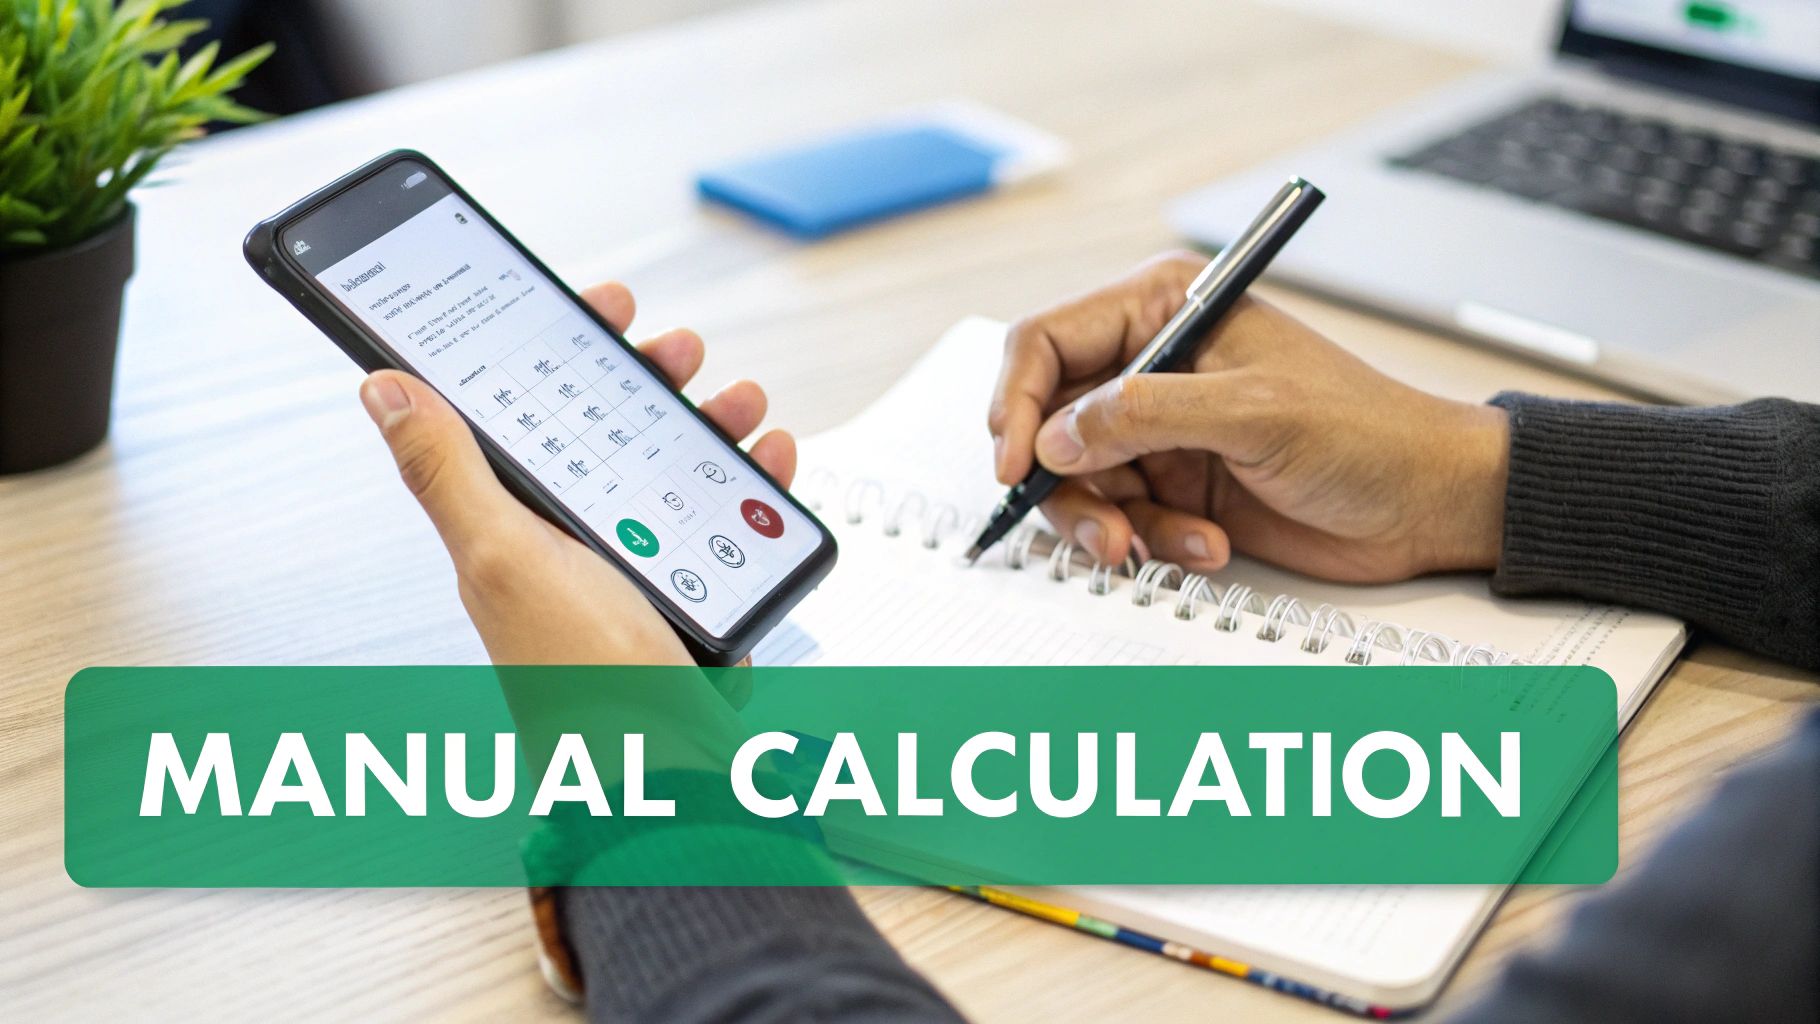
Calculating Engagement Without Fancy Tools
Before you jump to an automated social media engagement calculator, it's worth knowing how to crunch the numbers yourself. Honestly, understanding the manual process gives you a much better feel for what the data actually means. It helps you gut-check the tools and truly get a handle on the mechanics behind your performance.
Think of it like learning to cook without a recipe book. You start to understand why things work, not just that they do. This hands-on approach connects you directly with the raw numbers your audience is giving you with every like, comment, and share.
Finding Your Raw Data on Each Platform
First things first, you need to know where to find the numbers. Every platform tucks its analytics away in a slightly different spot, but they all provide the essential data for free right inside their native tools.
Instagram: Head to your professional dashboard and tap on "Account Insights." From there, you can see metrics like Reach, Likes, Comments, and Saves for any post or Reel. Just make sure you select the right timeframe.
Facebook: On your business page, look for "Insights" or the "Meta Business Suite." You can dig into individual post performance to see reach and a full breakdown of reactions, comments, and shares.
X (formerly Twitter): You'll find your data in X Analytics. Click "More" on the navigation bar, then "Creator Studio," and finally "Analytics." This gives you a detailed tweet-by-tweet look at impressions and total engagements.
The social media ecosystem is massive, and each platform offers unique ways for people to interact.
This web of connections is exactly why doing the math yourself is so valuable. It forces you to get familiar with the specific metrics that matter on each platform your audience uses.
Putting the Formula into Practice
Alright, once you've got your numbers, it's time to plug them into the formulas we talked about. Let's walk through a real-world example to see how it works.
Imagine you posted an Instagram Reel and want to calculate its Engagement Rate by Reach (ERR).
1. Grab Your Metrics from Instagram Insights First, pull the data for that specific Reel:
Reach: 12,500 people
Likes: 850
Comments: 75
Saves: 125
Shares: 50 (if available)
2. Add Up Your Total Engagements Next, sum up all those interactions.
850 (Likes) + 75 (Comments) + 125 (Saves) + 50 (Shares) = 1,100 total engagements.
3. Plug It Into the ERR Formula Now for the easy part. The formula is (Total Engagements / Reach) x 100.
(1,100 / 12,500) x 100 = 8.8%
So, your Engagement Rate by Reach for this Reel is 8.8%. That number isn't just a vanity metric; it tells you that nearly 9% of the unique people who saw your Reel felt compelled to actually do something.
Manually calculating your engagement rate is more than just a math exercise. It’s a strategic deep dive that reveals the true impact of your content, post by post, and builds a foundational understanding no automated tool can replace.
Doing this consistently turns abstract numbers into a clear story about what's working and what isn't. Run this calculation for your best and worst-performing posts, and you'll quickly spot patterns in what truly gets your audience talking. That feedback is gold for planning your future content.
Choosing the Right Online Engagement Calculator
While crunching the numbers yourself gives you a solid feel for what goes into the engagement rate, let's be honest—it’s not a great use of your time long-term. This is where dedicated social media engagement calculators come in. They’re all about working smarter, not harder.
These tools handle the tedious number-crunching instantly, which frees you up to do the important work: analyzing the results, spotting trends, and figuring out what your audience actually wants. You can quickly see which content formats are hitting the mark and which are falling flat, allowing you to adjust your strategy on the fly.
What to Look for in an Engagement Calculator
Not all calculators are built the same. A simple tool might just spit out a single number, but a great one provides the context you need to make smart decisions. When you're shopping around, there are a few features that are absolute game-changers.
A top-tier calculator should offer:
Multi-Platform Support: You need a tool that can pull data from all the places you're active—Instagram, Facebook, X, TikTok, you name it. Juggling different tools for each platform is a headache.
Formula Flexibility: A good tool understands that one metric doesn't tell the whole story. It should let you toggle between formulas like Engagement Rate by Reach (ERR) and Engagement Rate by Post (ER Post) to get a more complete view.
Clear Data Visualization: Raw numbers can make your eyes glaze over. Look for tools that present data with clean charts and graphs, making it much easier to identify patterns and share your findings with your team or clients.
Competitor Analysis: Some of the best tools on the market let you peek at your competitors' public data. This is an incredible way to benchmark your performance and see what’s resonating within your niche.
As you get more serious about your metrics, it's worth a deeper dive into mastering social media analytics tools that go beyond just engagement to give you a full picture of your performance.
A calculator's job isn't just to give you a percentage. It's to help you answer the "so what?" behind the number. The best tools transform raw data into a clear roadmap for what to post next.
Free Tools vs. Integrated Suites
Your budget and the complexity of your needs will likely be the deciding factors here. Free, web-based calculators are fantastic for quick spot-checks or if you're just dipping your toes into analytics. They’re straightforward, accessible, and perfect for a simple analysis.
But as your social media presence grows, you'll probably find yourself needing more firepower. That’s when an all-in-one social media management suite starts to make a lot of sense. These platforms bundle powerful analytics with other essential features like post scheduling and automated reporting. For those who live and breathe Instagram, exploring the best Instagram analytics tools can unlock platform-specific insights you won't find anywhere else.
Here’s something to keep in mind: the world is mobile-first. With social media ad spend expected to reach a staggering $276.7 billion by 2025 and 80% of all social media use happening on phones, any tool you choose must be able to analyze mobile-centric metrics. This is especially true for video, where 78% of users say they prefer watching short videos to learn about a product. Digging into these social media consumption habits will help you focus on the metrics that truly matter.
Turning Your Engagement Data into Action

Alright, so you've got your engagement rate. Now what? That number is just a starting point. The real magic happens when you use that percentage to make smarter decisions about what you post, when you post it, and how you connect with your audience.
One of the first questions I always hear is, "What's a good engagement rate?" Honestly, industry benchmarks can be a bit of a trap. A massive brand might be thrilled with a 1-2% engagement rate, while a smaller account with a super-dedicated following could easily hit 5-8%.
Your most important benchmark is your own historical performance. The goal is to consistently improve upon your average, not to chase a generic number that doesn't account for your unique audience and niche.
By tracking your own data over time, you establish a baseline that actually means something for your community. That's how you build real, sustainable growth.
Uncovering Your Content Goldmine
Think of your analytics as a treasure map. It’s time to dig in and find what I call your "content goldmine"—the posts that truly resonated with your followers. Start by pulling up your top-performing content, the ones with the highest engagement rates.
Don't just glance at the numbers. You need to play detective and figure out why they worked so well.
Ask yourself a few key questions about each successful post:
What was the topic? Did you hit on a common pain point, share a client success story, or give a raw behind-the-scenes look?
What was the format? Was it a quick-hitting Reel, an in-depth carousel, a static image, or a simple text post?
What did you ask them to do? Did your call-to-action prompt a specific response, like answering a question, sharing their own experience, or saving the post for later?
When did you post it? Do you see a pattern emerging around certain days or times?
And here’s a pro tip: do the same thing for your worst-performing content. Your "flops" are often better teachers than your hits because they show you exactly what your audience isn't interested in. This process creates a powerful feedback loop to guide your strategy.
Building a Data-Driven Content Calendar
Once you start spotting these patterns, you can stop guessing and start creating with purpose.
If you realize that educational carousels consistently get more saves and shares than single-image posts, then it's time to build more of them into your calendar. If you find that ending your captions with a direct question doubles your comments, make that a standard practice. This is how you move from hoping content will work to knowing it will.
Remember, people's attention is fragmented. In 2025, the average person is active on nearly seven different platforms a month, spending over two hours a day scrolling. This multi-platform world means your content has to be optimized to grab attention instantly. If you're curious about the broader trends, it's worth taking a look at these insightful social media marketing statistics.
Use your findings to run simple A/B tests. Post similar content at different times—say, Tuesday morning versus Thursday evening—and see what happens. Test different headline styles or visual formats. These small, data-backed tweaks can lead to massive improvements over time. For more actionable ideas, check out our guide on how to increase Instagram engagement organically.
Your Top Engagement Calculation Questions, Answered
Once you get the hang of the formulas, the real questions start to pop up. This is where the theory hits the road, and you run into the same hurdles most social media managers face when they start digging into the numbers.
Let's tackle some of the most common sticking points.
So, what's actually a good engagement rate? This is probably the number one question I hear. While you can find industry benchmarks online, the truth is, "good" is completely relative. A B2B tech brand might be thrilled with a 1-2% engagement rate, but a niche brand with a die-hard community of knitting enthusiasts could easily pull in 8-10%.
The only benchmark that truly matters is your own. Your goal should always be to improve on your past performance, not to hit some arbitrary industry number.
Followers vs. Reach: Which Denominator Should I Use?
This is a classic dilemma, but the answer really boils down to what you're trying to measure.
Think of it this way: using your follower count is like taking your brand's pulse. It gives you a consistent, stable baseline to see how your content is landing with your dedicated audience over time. It’s the perfect metric for tracking the overall health of your community from month to month.
Using reach, on the other hand, tells you how effective a single piece of content was with the unique audience that actually saw it. This is your go-to for analyzing the performance of individual posts, especially if one happens to go viral and reaches a ton of people who don't follow you yet.
My Two Cents: Don't pick one—use both. I always recommend tracking engagement by followers for your monthly reports to keep an eye on community health. Then, use engagement by reach to dissect individual posts to see what’s really grabbing people's attention. This combo gives you the complete picture.
How Often Should I Be Calculating This Stuff?
Consistency is everything, but that doesn't mean you need to be glued to your analytics 24/7. In fact, obsessing over daily fluctuations can make you reactive and kill your strategy. It’s much better to set a regular rhythm that works for you.
Here’s a schedule that I’ve found works for just about everyone:
Weekly Check-ins: Take a glance at your best and worst-performing posts for the week. This isn't about deep analysis; it's about staying nimble and spotting little trends as they happen.
Monthly Analysis: This is your main event. Carve out time to calculate your overall engagement rate for the entire month. How does it stack up against last month? Are there any bigger patterns emerging?
Quarterly Strategy Reviews: Time to zoom out. Look at your long-term trends to inform your strategy for the next 90 days. Maybe those behind-the-scenes videos are consistently outperforming everything else. Now’s the time to double down on what works.
What if My Engagement Rate Is Terrible?
It’s a tough pill to swallow when you’ve built a big audience, but the likes and comments just aren't there. A low engagement rate is almost always a sign of a disconnect. It means your content isn't aligning with what your audience wants or expects from you.
If your numbers are in a slump, it's time to play detective. Are you being too salesy? Are you just broadcasting messages instead of starting conversations? Could you be posting when your audience is asleep? Don't get discouraged. A low rate is just feedback, a clear signal that it's time to adjust your strategy and get back in touch with what your community truly cares about.
Ready to stop guessing and start growing? Gainsty uses advanced AI and expert strategy to help you attract real, engaged followers on Instagram.

.png&w=1920&q=75&dpl=dpl_5vvnEneLD2DAfKTSR86kjNKSWjSC)


.png&w=750&q=75&dpl=dpl_5vvnEneLD2DAfKTSR86kjNKSWjSC)