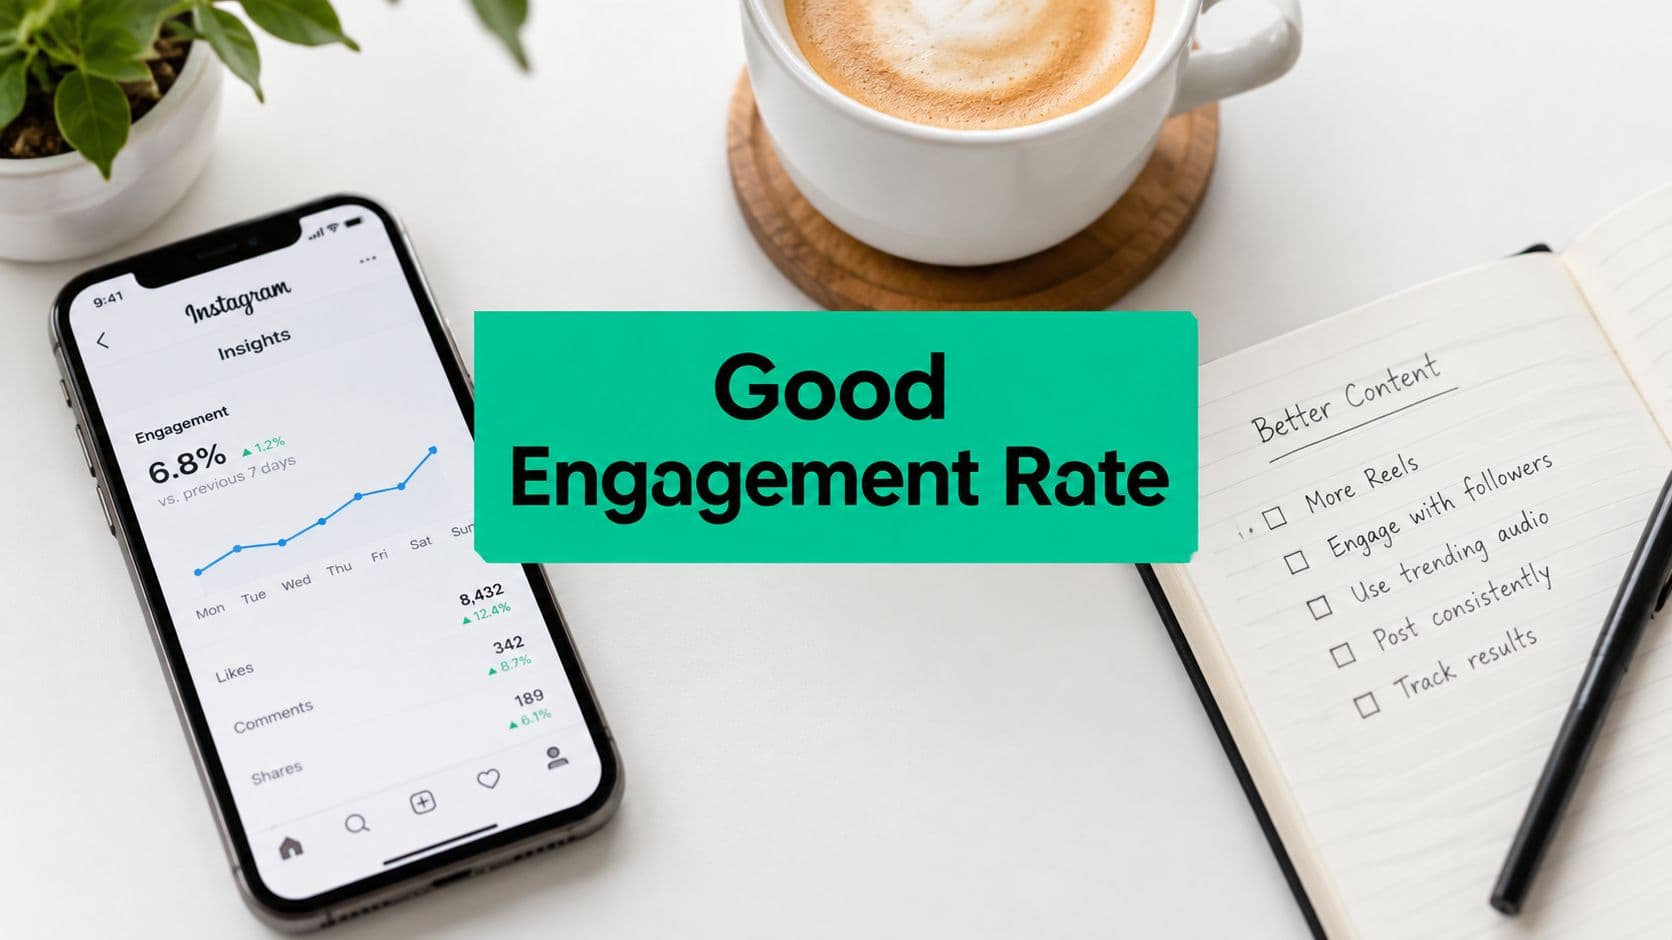
Understanding What Is a Good Instagram Engagement Rate
Consider two brand accounts. The first has a large follower base but receives little interaction from each post. The second has a smaller audience, yet its followers regularly comment, save, and share the content. If both teams report only follower count, the first account appears healthier. If they examine engagement rate, the second may have the stronger community.
Rival IQ's 2025 Social Media Industry Benchmark Report analyzed more than 4 million posts and 9 billion interactions across industries. Using a follower-based formula, it found a median Instagram engagement rate of 0.36% across all industries, while the top 25% of brands achieved approximately 1.05% or higher. You can review the methodology in Rival IQ's Instagram engagement benchmark.
That creates a useful performance curve:
Below 0.36% may indicate weak audience response, limited distribution, or an inactive follower base.
From 0.36% to about 1% is broadly competitive for a brand account under this follower-based benchmark.
Around 1% or higher is a strong brand-level result, and approximately 1.05% represents top-quartile performance in the cited dataset.
Think of the benchmark like a classroom grade curve. A score near the middle tells you that you're keeping pace with the class. A score near the top shows exceptional performance, but it isn't a sensible minimum for every student on every assignment. In the same way, 1% is a strong achievement, not a mandatory starting point for every creator, startup, influencer, or established brand.
Why the account context changes the answer
A smaller account may have closer relationships with its followers, while a larger brand may carry inactive or lightly exposed followers accumulated over time. Industry, audience relevance, content format, geography, and distribution all affect the result.
The benchmark spans varied sectors, including food and beverage, sports, nonprofits, and other brand categories. That makes it a useful starting point, not a niche-specific guarantee.
Practical rule: Never call a rate good until you can state the denominator beside it.
A healthy evaluation therefore asks three questions. Is the account above its own historical baseline? Is it competitive with similar accounts using the same formula? Do the interactions represent useful audience behavior, such as thoughtful comments, saves, shares, profile visits, or enquiries?
The percentage starts the conversation. It doesn't finish the diagnosis.
How to Calculate Your Instagram Engagement Rate
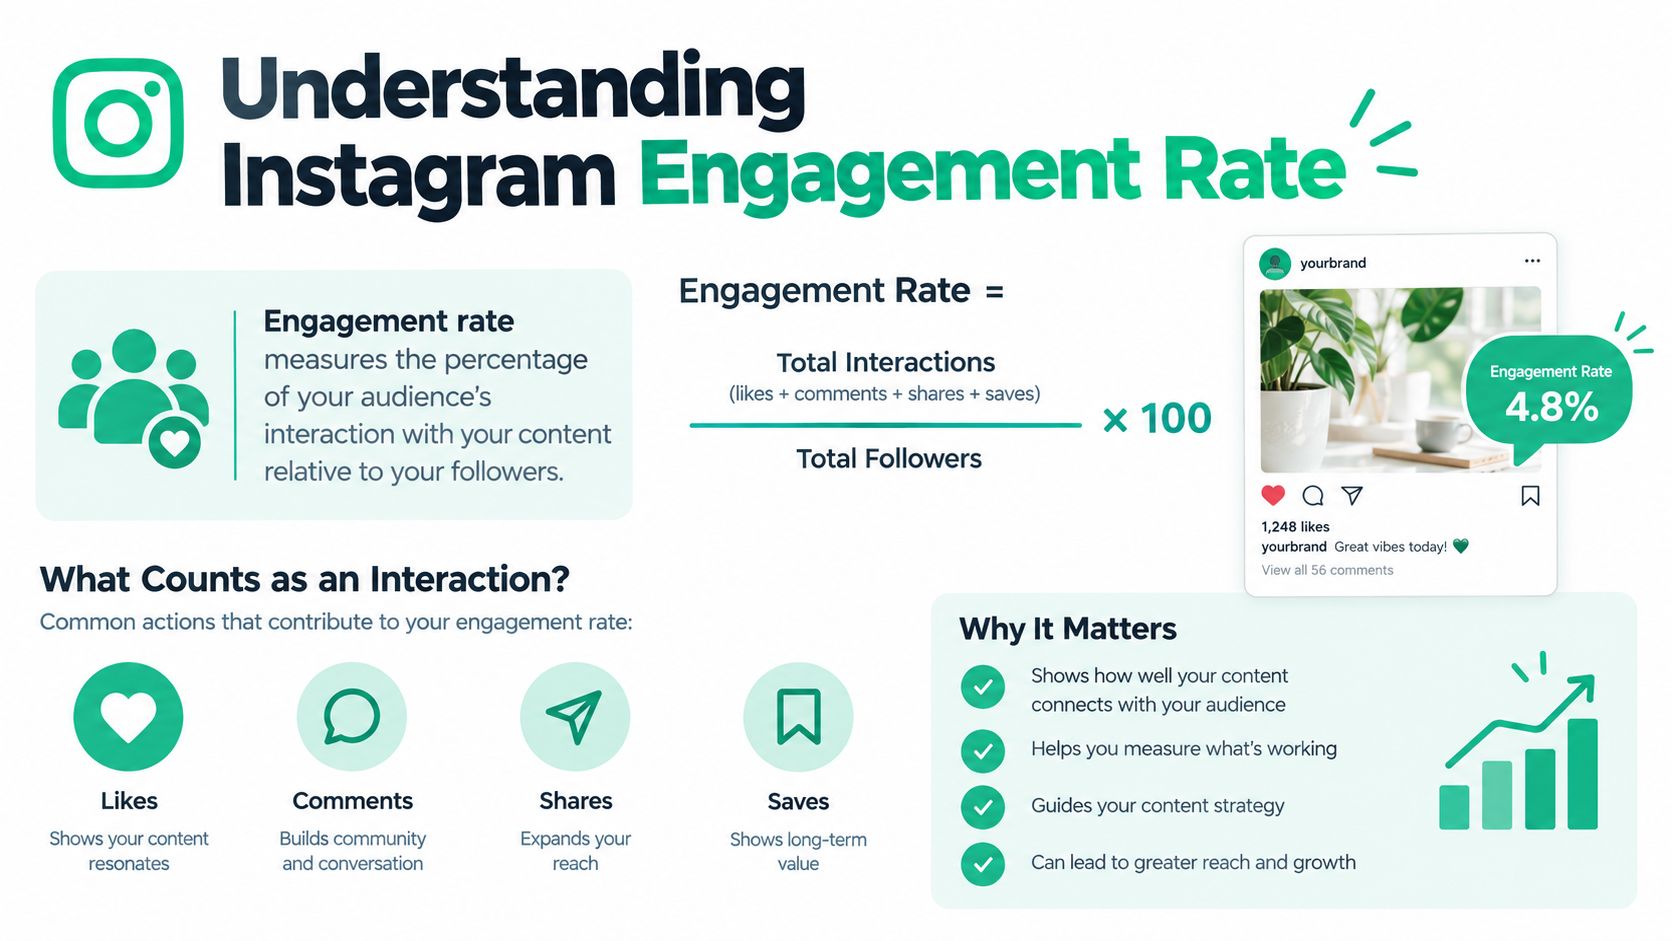
Start with the follower-based formula because it gives you a consistent view of audience health:
Engagement rate by followers = (total engagements per post ÷ total followers) × 100
For example, an account with 10,000 followers that receives 500 interactions on a post has this calculation:
(500 ÷ 10,000) × 100 = 5%
The arithmetic is simple. The difficult part is deciding what counts as an interaction and applying the same rule every time. Your dashboard might include likes, comments, shares, and saves, while another report might count only likes, comments, and shares.
For a reliable internal comparison, record the included actions, the post format, and the date range. Then use the same definition across your posts. Gainsty's guide to the Instagram engagement rate formula can serve as a reference when documenting the calculation for a team.
Followers and reach answer different questions
Reach-based engagement uses the number of unique accounts that saw the post:
Engagement rate by reach = (total engagements ÷ reach) × 100
Suppose the same post reached 2,000 people and generated 500 interactions. Its reach-based rate would be 25%, even though its follower-based rate was 5%. The numbers differ because the denominators describe different audiences.
Rival IQ uses interactions divided by followers. Dash Social's 2025 Instagram benchmark reports an overall average of 3.6% using likes, comments, and shares divided by reach. The figures aren't contradictory, because reach measures the response of exposed users, while followers measure the responsiveness of the accumulated audience. See the Dash Social Instagram benchmark for its calculation context.
A follower-based rate uses total followers as the denominator and answers the question, “How healthy is the accumulated community?” A reach-based rate uses unique accounts reached and answers, “How strongly did exposed users respond?” An impressions-based rate uses total displays, including repeat views, and helps explain how interactions relate to total exposure.
Reach-based rates can be higher when Instagram distributes content beyond followers through recommendations, Explore, or shares. A large account may show a lower follower-based result because many followers aren't exposed to every post.
Your dashboard should report both rates where the data is available. Then segment results by format, and review saves, shares, and comment quality separately. A sudden increase deserves investigation before you treat it as organic progress, particularly if the interaction pattern looks unrelated to the content.
Industry Benchmarks and Trends for 2026
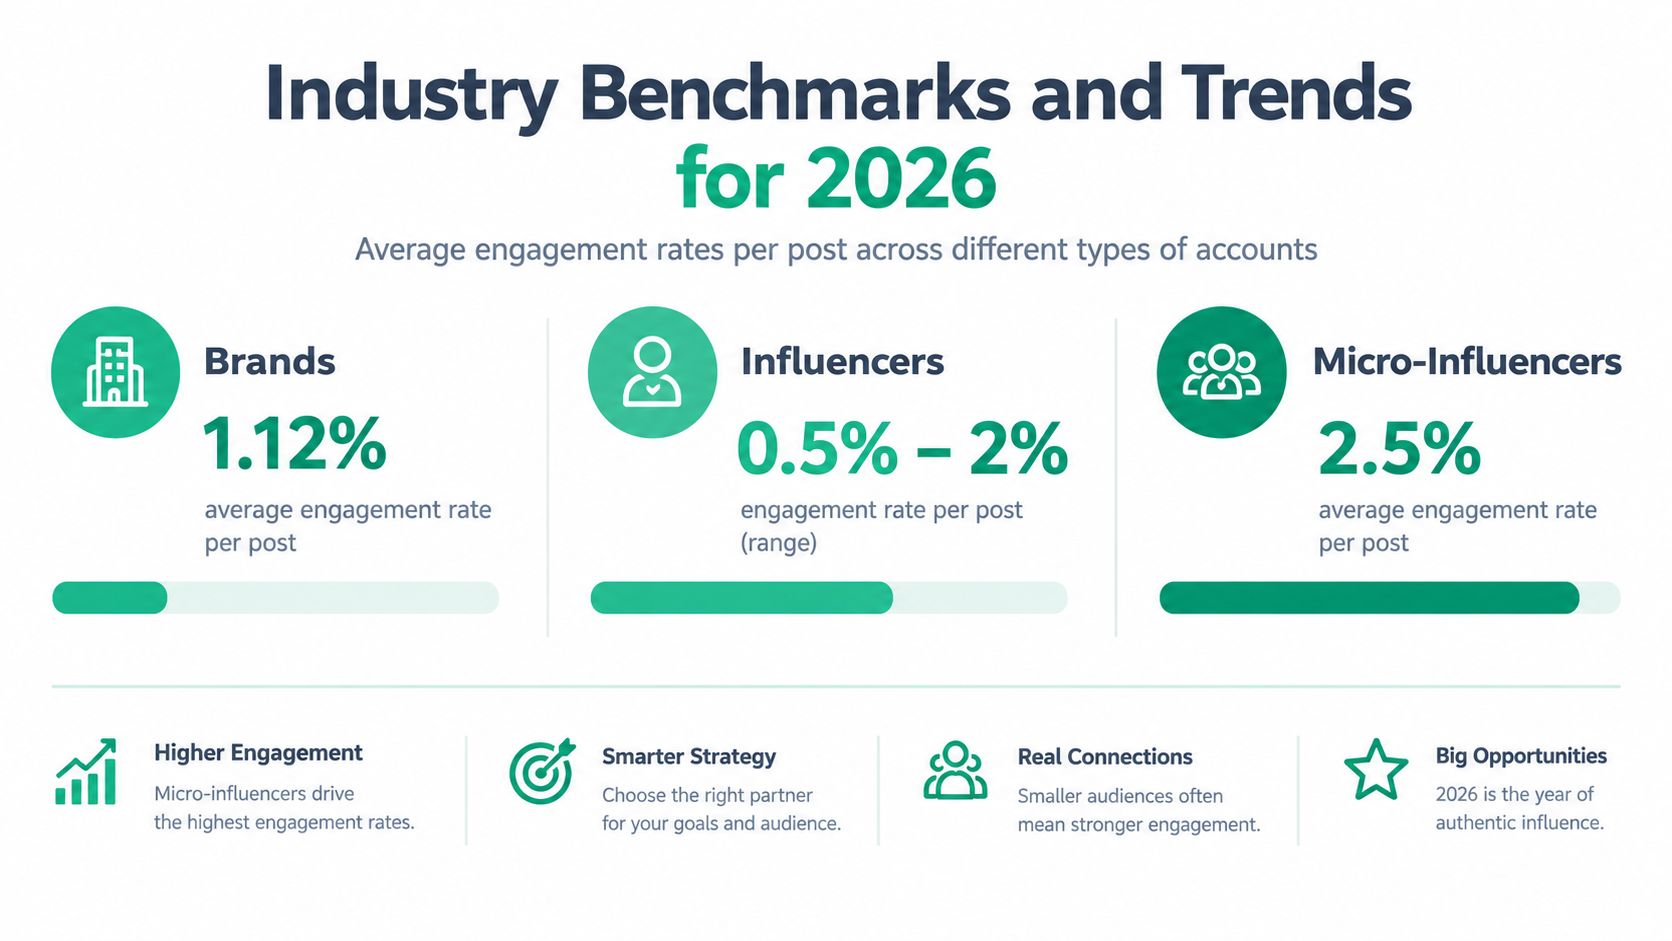
Instagram engagement benchmarks have declined over time, so older targets can mislead. Rival IQ reported an all-industry median of 0.47% in its 2023 Social Media Benchmark Report, compared with 0.36% in its later 2025 benchmark. That is a decrease of about 0.11 percentage points, or roughly 23% relative to the earlier figure, as documented in the Socialinsider Instagram benchmark overview.
The useful conclusion is not that every account is underperforming. More content competes for attention, so targets need a defined year, formula, format, and peer group. A percentage without its denominator is like a test score without knowing the grading scale. Follower-based and reach-based rates answer different questions.
Why reports don't always agree
Socialinsider reports an overall Instagram average of approximately 0.48% and a 24% year-over-year decrease. Its format figures are 0.52% for Reels, 0.55% for carousels, and 0.37% for image posts. The same Socialinsider dataset lists earlier format figures of 0.50% for Reels, 0.55% for carousels, and 0.45% for image posts, as shown in the Socialinsider Instagram benchmark overview.
Those figures can coexist with Rival IQ's results because reports may differ in account populations, engagement actions, formats, and denominators. A follower-based median and a reach-based average should not be compared as though they measure the same audience.
For a fuller explanation of year-over-year comparisons, see this guide to social media trend analysis.
Use a rolling baseline
A rolling baseline gives your team a more practical reference than a universal target. Track each format consistently, then compare recent posts with your own earlier results and with methodologically similar peers.
A result near 0.5% may be average in some datasets, depending on the method used. A result around 1% or higher is a strong ambition in follower-based brand benchmarks. If your rate is rising alongside stronger saves and shares, that may indicate healthier content resonance. If the rate rises but interaction patterns look suspicious, you should investigate quality and traffic sources before drawing conclusions.
A result near 0.5% may be average in some datasets, while 1% or higher remains a strong follower-based ambition for brands. Pair the rate with audience quality, content usefulness, and business outcomes.
Format Performance Comparison Across Content Types
The familiar advice that Reels automatically win engagement is too simplistic. In Socialinsider's 2025 analysis of 35 million posts from 447,613 accounts, carousels averaged 0.55%, Reels averaged 0.52%, and static images averaged 0.37%. The analysis reported an overall average of 0.48%, down 24% year over year, as summarized in Social Media Format Performance Research.
Carousels averaged 0.55% and are often best when the goal is to teach, explain, or earn saves. Reels averaged 0.52% and are often strongest when the opening can hold attention and attract discovery. Static images averaged 0.37% and tend to work best when the image communicates a clear, immediate idea.
Why carousels can win
A carousel gives the audience several opportunities to continue. A strong first slide earns the swipe, later slides develop the idea, and the final slide can invite a save, share, comment, or profile visit. That makes the format especially useful for tutorials, comparisons, checklists, product education, and evergreen references.
A Reel may generate more views but fewer meaningful actions. A carousel may attract fewer casual viewers while producing more saves from people who want to return to the information. For a brand, the second outcome may be more valuable during consideration or purchase research.
Compare output, not assumptions
Format averages are platform-wide reference points, not universal targets. Account size, niche, geography, posting frequency, and denominator can materially change the result. A rushed video shouldn't receive more production resources merely because video is fashionable.
Teams that lack design capacity can test an AI carousel maker as part of a structured workflow. The tool can help turn a proven idea into a swipeable draft, but the team still needs to verify the hook, examples, brand accuracy, accessibility, and call to action.
Track each format against normalized engagement and downstream outcomes. Compare saves, shares, profile visits, follows, leads, or sales rather than optimizing for views alone. For a broader perspective on changing video strategy, see Gainsty's guide to Instagram Reels in 2026.
Beyond Basic Metrics, Private Signals Matter Most
A public like is easy to give and easy to forget. A save usually means the person expects future utility, while a share suggests that the content was relevant enough to pass to someone else. A thoughtful comment requires more effort than a tap, so teams should examine the quality and direction of conversation, not only the total interaction count.
The denominator still matters here. Engagement by followers measures interactions against the total follower base. Engagement by reach measures interactions against unique people who saw the post. Engagement by impressions can include repeat views from the same user, which changes the meaning again. HubSpot's explanation of Instagram engagement rate provides useful background on these distinctions.
Read the signals separately
Don't combine every action into one score and assume the total explains performance. A post can have modest public activity but strong saves, or broad reach with little evidence that viewers found the content useful.
Use a diagnostic view like this:
Likes: A quick indication of immediate approval.
Comments: Evidence of conversation, questions, objections, or community participation.
Saves: A signal that the audience may want to use the content later.
Shares: A sign that the idea travels beyond the original viewer.
Profile visits and enquiries: Signals that engagement may be moving toward a business outcome.
A smaller audience that repeatedly saves and shares useful content can be more valuable than a larger audience that scrolls past it.
This is why follower growth shouldn't be judged by follower count alone. Acquiring relevant followers can initially dilute a follower-based rate, because the denominator grows before new people develop a habit of interacting. If those followers later increase reach, saves, shares, enquiries, or sales, the temporary dilution may represent healthy expansion rather than deterioration.
For a deeper look at how interaction language can reveal buying intent, read these lessons from millions of social comments. Then review individual posts for the actions that matter to your objective. An educational creator may prioritize saves, a local service business may prioritize messages, and a product brand may care more about profile visits and qualified questions than a large like count.
The strongest benchmark is therefore your own rolling baseline, segmented by format, audience size, and reach source. Percentages help you compare. Private signals help you understand.
Practical Strategies to Improve Your Engagement Rate
Improvement starts with a clean measurement routine, then moves into content decisions. Keep follower-based and reach-based rates in the same report, label the denominator clearly, and compare formats separately. A single blended number can hide the difference between a loyal community and a post that briefly reached an unusually small audience.
For influencers and creators
Choose one audience problem and build content around it. A fitness creator can turn a recurring question into a carousel, then use a Reel to demonstrate the movement. A specialist creator can ask a precise question in the caption, such as which step causes the most difficulty, instead of ending with a vague request for opinions.
Reply to useful comments with equally useful answers. A response that adds an example or clarifies a misunderstanding gives the original commenter a reason to continue the conversation.
For small businesses
Show the decision process behind the product. Use carousels for comparisons, care instructions, or selection guidance, and use Reels when movement, demonstration, or atmosphere carries the message. If product photography slows production, explore AI workflows for Instagram product images, then edit every output so it accurately represents the actual product.
Write captions that invite a specific response. Ask customers to choose between two options, describe their use case, or submit a question that your team can answer publicly. Track whether those interactions lead to profile visits, messages, enquiries, or purchases.
For larger brands and agencies
Create a format-level testing sheet. Record the denominator, content type, reach source, saves, shares, comment quality, profile activity, and the business outcome connected to the post. Review the results on a rolling basis instead of changing strategy after one unusually high or low post.
Use AI and automation to reduce repetitive work, not to manufacture audience activity. Gainsty is one option for teams seeking an Instagram growth assistant with targeting, analytics, and organic follower-growth support, while human reviewers should continue to protect relevance, tone, and authenticity.
Measurement habit: Every target should name the format, denominator, time period, and business outcome beside the percentage.
Finally, test one change at a time. Improve the opening slide, revise the caption question, adjust the content format, or strengthen the response process, then compare the result with a similar baseline. A good Instagram engagement rate is not a permanent badge. It's a moving indicator of whether the right people find your content useful enough to respond.
Gainsty helps creators, startups, and brands monitor Instagram performance and pursue organic follower growth without relying on bots or fake followers. Visit Gainsty to connect audience targeting, analytics, and engagement-focused growth with the denominator-aware measurement approach described here.

.png&w=1920&q=75&dpl=dpl_2si4hWs7xtpQVmrY6d8xhJ1wLJZL)





.png&w=750&q=75&dpl=dpl_2si4hWs7xtpQVmrY6d8xhJ1wLJZL)