Introduction to Instagram Engagement
Maya posts a new carousel and checks it against yesterday's image. The carousel has fewer likes, so it seems weaker at first. Then she sees that people saved it and sent it to friends. Those quieter actions may show that the post is more useful, even with a smaller visible like count.
That example captures a common mistake. A raw interaction count can make one post look successful and another look disappointing, without showing how many people had the chance to respond. A better comparison connects actions with reach or follower count and considers what people did.
Instagram engagement is the percentage of an audience that interacts with a post or account.
“Audience” can mean followers or people reached, depending on the formula. Common measurements divide actions such as likes and comments by follower count. Academic research also examines engagement through likes per follower and comments per follower academic research on Instagram engagement mechanisms.
The useful question is efficiency: how well did the content turn exposure into action? A post with fewer total interactions may perform more efficiently if it reached a smaller audience and persuaded a larger share of viewers to respond. A post with many likes may be less efficient if it was shown to far more people.
Saves and shares deserve special attention. Likes are easy to see, while saves and shares often happen privately. A save can signal future usefulness, and a share can show that the content was relevant enough to pass along. These actions help move engagement beyond a vanity score.
The baseline you need before judging results
Broad Instagram benchmarks place average engagement around 0.45% to 0.48% in 2026. The cited benchmark source reports 0.48% in early 2026 and 0.45% in Q2 2026 2026 Instagram statistics and benchmark data. Use those figures as comparison points, not automatic grades.
Account type, audience size, niche, format, and measurement method can change the result. A niche creator with a closely connected audience may produce a different pattern from a large brand account.
A repeatable review process also benefits from organized content planning. Zemith's guide to social planning with Zemith covers themes, publishing decisions, and review routines that can support consistent engagement tracking.
What Instagram Engagement Really Means
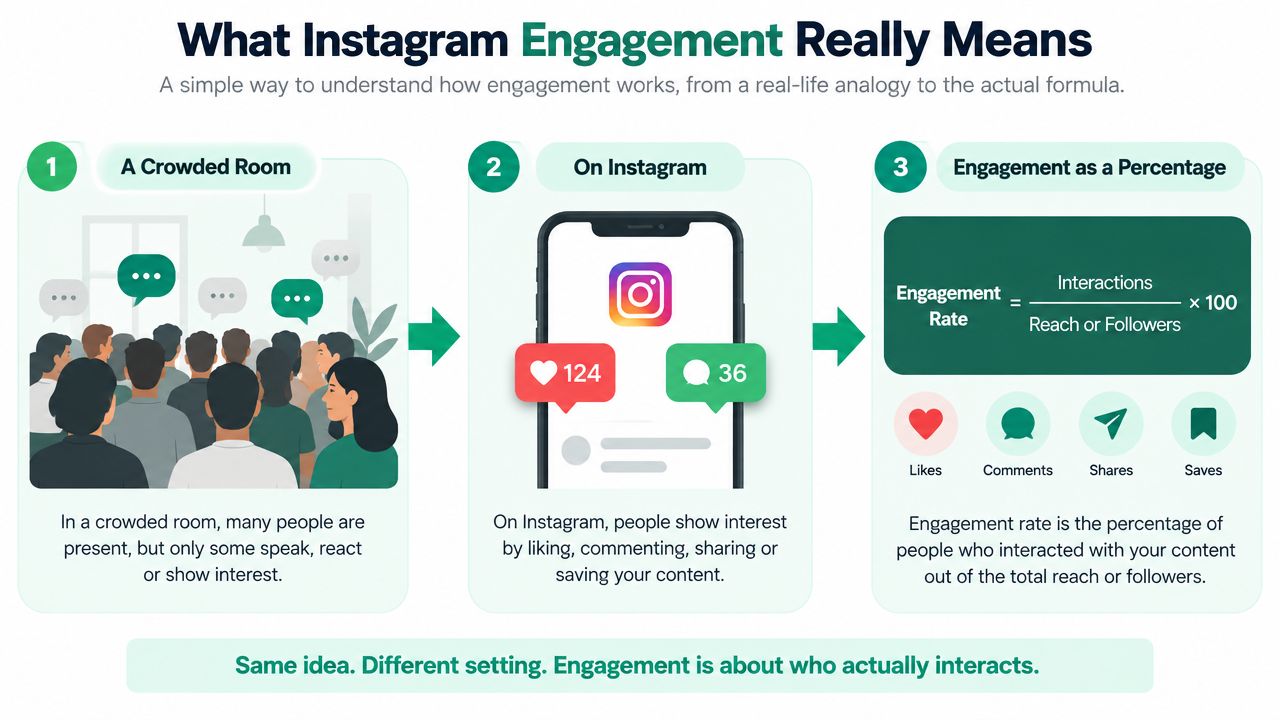
Think of Instagram as a crowded room. Hundreds of people may be present, but only some raise a hand, ask a question, recommend the conversation to a friend, or write down a useful idea for later.
The people in the room represent your potential audience. Their reactions represent engagement. The percentage matters because it shows how efficiently your message turned attention into action, rather than counting how many people were present.
From interaction to rate
Start with the simplest version:
Engagement rate = interactions ÷ audience × 100
“Interactions” can include likes, comments, saves, shares, replies, and other actions you choose to track. “Audience” can mean followers or reach.
Follower-based measurement asks: How much response did this post generate relative to the account's follower base?
Reach-based measurement asks: How effectively did the people who saw this post respond?
Suppose a post receives 50 interactions and reaches 1,000 people. Its reach-based rate is 5%. If the same post appears on an account with 10,000 followers, its follower-based rate is 0.5%. The interaction count stays the same, but the denominator changes the meaning.
That example is not a benchmark. It shows why comparing rates requires a clear formula.
Why raw counts create confusion
Raw likes tend to favor larger audiences. An account with more followers has more potential people who can react, but that does not prove its content creates stronger participation. Rates make comparisons more useful across accounts, posts, and time periods.
Rates still need context. A carousel, Reel, and single-image post invite different behaviors, and current format benchmarks list carousels around 0.50%, Reels around 0.48%, and single-image posts around 0.33% current Instagram format benchmarks. The same account can therefore produce different engagement rates by changing the format.
Private actions also change what engagement means. Saves and shares may be less visible than likes, yet they can signal usefulness or personal relevance. A post that earns fewer public reactions may still work efficiently if people save it for later or send it privately.
Read engagement as a comparison, not a verdict.
Compare each post with your own recent posts using the same formula first. Then compare it with current benchmarks for the same format and account context. This gives you a more reliable answer than asking whether a particular like count “looks good.”
Key Interactions That Count Toward Engagement
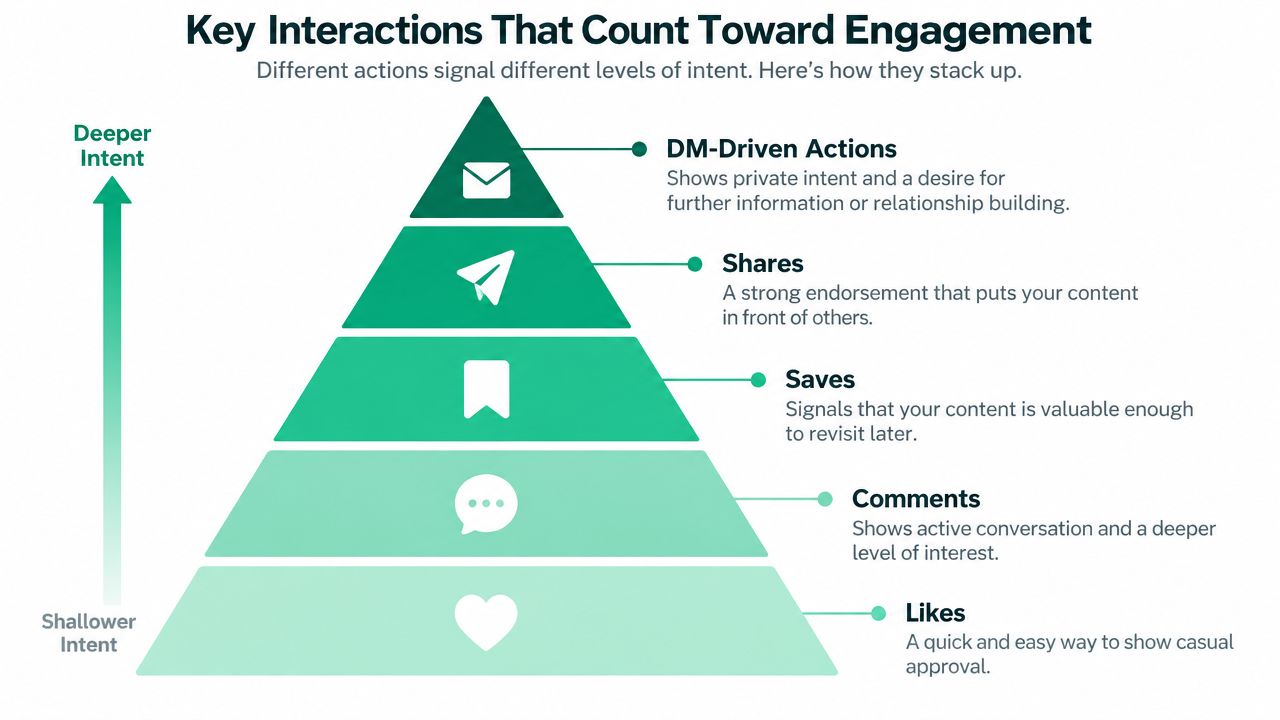
A post can collect many likes and still create little lasting value. Likes are the lightest signal. Someone may tap the heart while scrolling without remembering the post, changing plans, or sending it to anyone.
Comments require more effort. A thoughtful reply can show that the post raised a question, disagreement, emotional response, or sense of community. Comment volume still needs context, because a busy discussion does not automatically mean the participants are relevant to your goal.
Saves point to future utility. People save checklists, tutorials, recipes, explanations, and product ideas when they expect to return to them. Shares show that the viewer considers the content useful, relatable, surprising, or relevant to another person. Direct messages can reveal stronger private intent, such as asking for advice, making a recommendation, or starting a buying conversation.
Public actions and private actions
Likes and comments are public actions. They are visible and easy to report, so they help measure surface-level response.
Shares through messaging and DM conversations are private actions. Saves sit between both groups. The save itself is private, but it can show that the post solved a practical problem for the person who kept it.
A report on Instagram performance found that shares per reach rose by more than 150% while likes stayed flat and comments remained minimal, reporting on Instagram reach and engagement changes. The useful takeaway is that visible approval does not capture every valuable response. People may recommend or store content without leaving a public signal.
Audit the actions your posts earn
Open Instagram Insights and review the interaction mix, not only the total. Ask:
Likes: Does the post earn quick recognition?
Comments: Does it invite a genuine response?
Saves: Does it solve a problem people expect to revisit?
Shares: Would someone send it to a friend, colleague, or customer?
Messages: Does it give people a reason to begin a personal conversation?
A post with modest likes but strong saves may be an effective educational asset. A post with many shares may help distribution. Comments from the right customers can be more commercially useful than broad, shallow reactions.
Judge each interaction against the post's job. Educational content may aim for saves, while a recommendation post may aim for shares or messages. That purpose gives the numbers meaning.
How to Calculate Instagram Engagement Rate
A post can reach many people and still receive few actions. Another may reach a smaller audience but generate strong saves and shares. The formula you choose determines which story the numbers tell.
The follower-based formula is the familiar account-level comparison:
Follower-based engagement rate = likes + comments ÷ followers × 100
Use it when you need a consistent public measure across accounts or when Instagram Insights does not provide reach. It compares visible responses with the account's full follower base, including followers who may not have seen the post.
The efficiency formula uses reach:
Reach-based engagement rate = total interactions ÷ reach × 100
Total interactions may include likes, comments, saves, shares, and other actions. Define the included actions once, then apply that definition to every post. Because reach counts people who encountered the content, this formula is usually more useful for judging how efficiently a specific post turned exposure into action. This Instagram engagement rate formula guide explains how to compare these methods.
Formula comparison
Use likes + comments ÷ followers × 100 for public comparisons or consistent account tracking. It shows response relative to the follower base.
Use total interactions ÷ reach × 100 for post analysis and content efficiency. It shows how effectively reached viewers took action.
A quick worked example
A post receives 50 total interactions and reaches 1,000 people. Divide 50 by 1,000, then multiply by 100. The result is a 5% reach-based engagement rate.
If the account has 10,000 followers, divide 50 by 10,000 and multiply by 100. The follower-based rate is 0.5%.
Both results are valid because they answer different questions. The first measures the response among people reached. The second measures the response against the entire follower base.
Build a clean tracking habit
Choose one primary formula and keep it stable. Switching from likes divided by followers to total interactions divided by reach can create an apparent improvement that comes only from changing the calculation.
Record the same fields for each post:
Format: Carousel, Reel, or image
Reach: People who saw the post
Interactions: Actions included in your chosen definition
Rate: The resulting percentage
Quality signals: Saves, shares, and messages
Compare posts with similar formats and goals. A reach-based rate works well as an efficiency signal, while a follower-based rate supports broader account comparisons. Review saves and shares separately too, since private actions can show useful value that likes alone miss.
Instagram Engagement Benchmarks and What Good Looks Like
An account can collect more likes than last year and still reach fewer people. That is why engagement works better as an efficiency signal than a vanity score. Compare the actions a post earns with the people it reached, then compare that result with similar posts and accounts.
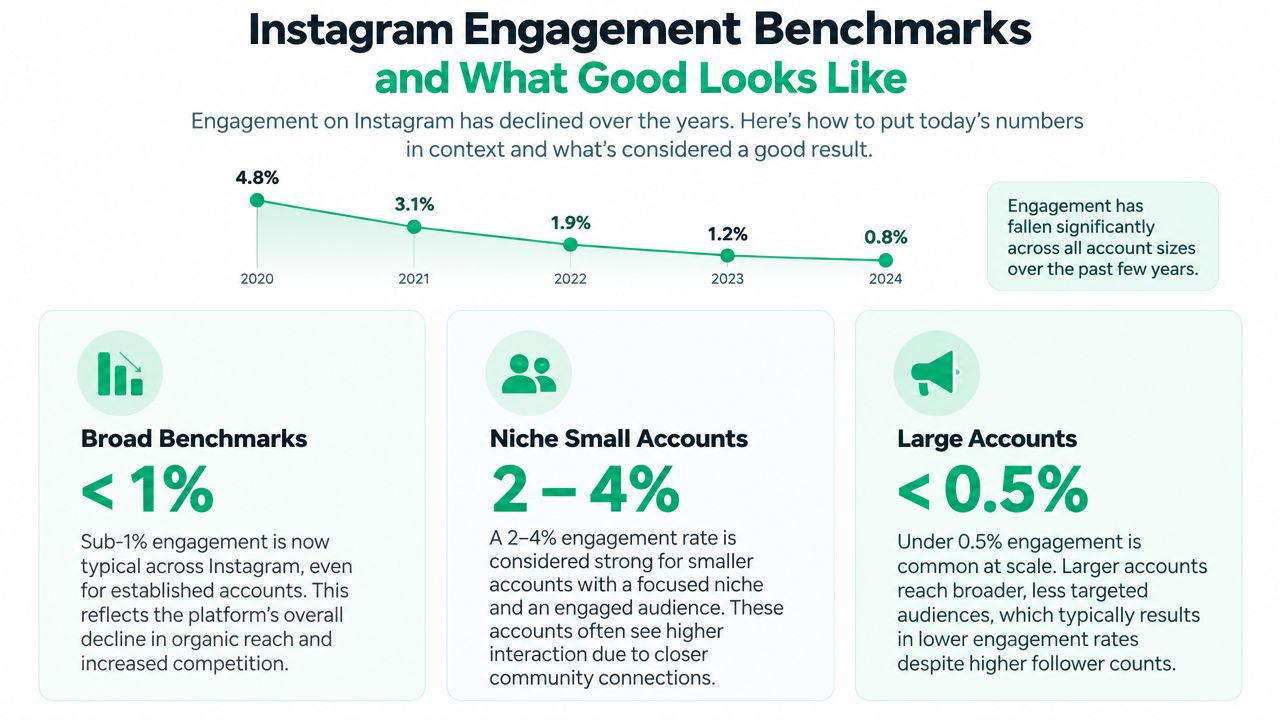
Older Instagram advice can make current performance seem disappointing. Historical benchmarks show median engagement falling from about 7.3% in 2024 to about 5.4% in 2025, a 26% drop in that dataset's historical Instagram engagement benchmarks. Other reporting places platform averages near 0.45% to 0.48% for 2026, depending on the method used.
These figures can coexist because studies may count different actions, audiences, account groups, and denominator formulas. The useful conclusion is clear: engagement is harder to earn at scale, and old norms can mislead you.
Use the right comparison group
Recent platform reporting places broad engagement averages below 1% in 2026. The same report lists carousels around 0.50%, Reels around 0.48%, and single images around 0.33% 2026 Instagram benchmark reporting. A rate near 0.5% can therefore sit close to the current norm in many markets, even when it looks small beside older advice.
Account size changes the comparison. Larger accounts may include more passive followers and receive broader distribution, while smaller niche accounts can build closer audience relationships. Compare similar account types instead of judging a local specialist against a large entertainment account.
Format matters too. Compare carousels with carousels, Reels with Reels, and images with images before deciding whether a result is strong.
A practical benchmark framework
Use three reference points:
Your own baseline: Compare the current post with recent posts using the same formula.
Your format baseline: Group posts by carousel, Reel, or image.
The current market baseline: Use recent benchmarks instead of old high single-digit expectations.
A result above its comparison group is encouraging. A lower result is a diagnostic signal, not a permanent label. Check the hook, topic, audience fit, format, and interaction mix. Give special attention to saves and shares, since private engagement can reveal usefulness that likes do not show.
How Content Design Influences Engagement
Posting more often won't fix content that gives people no reason to respond. The structure of a post changes how much attention and effort viewers need to invest before they can understand, use, or discuss the idea.
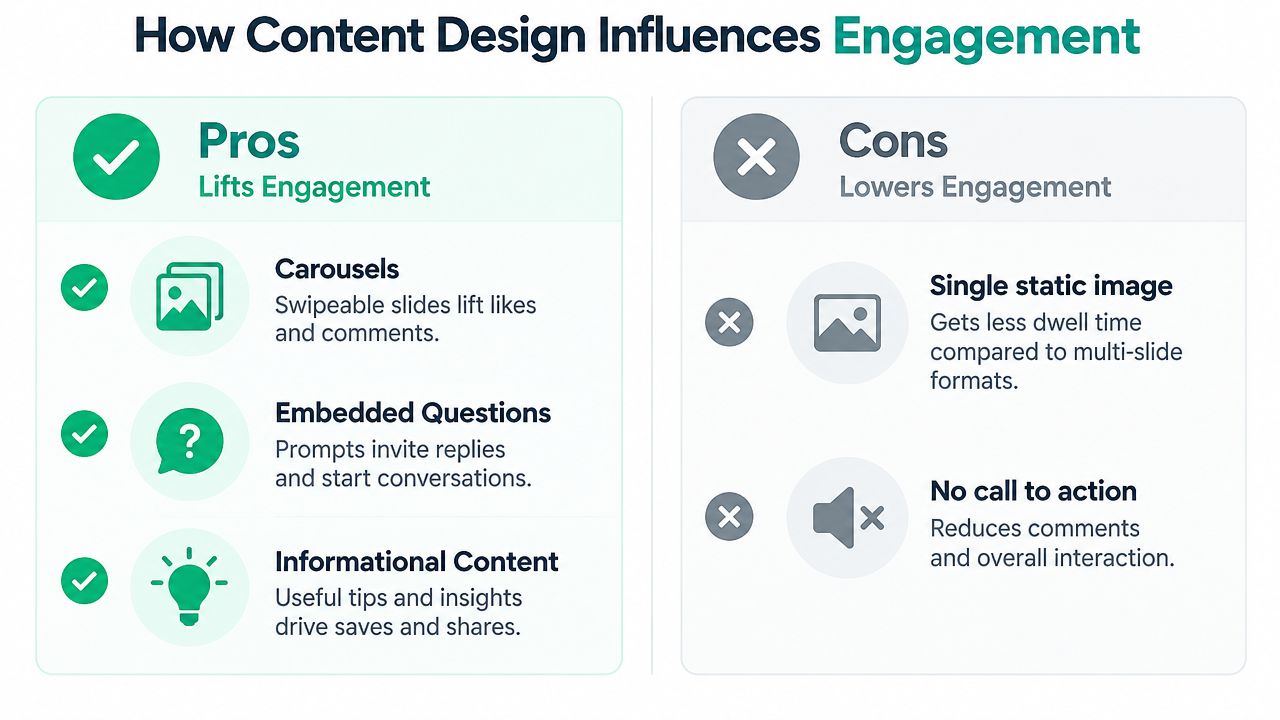
Research on Instagram post design found that carousel formats improved likes, embedded questions increased likes and comments, and informational content enhanced both likes and comments study of Instagram content structure and engagement. The same study found that transactional promotions reduced likes, while rational or holiday-style content decreased both likes and comments.
Design for a specific action
A carousel can break a complex idea into a sequence. The first slide earns attention, the middle slides deliver the explanation, and the final slide can invite a response or provide a concise conclusion.
Questions work because they reduce the distance between viewing and replying. Instead of ending with a broad statement, ask something your intended audience can answer from experience.
Informational posts can earn saves when they act like reference material. Use clear labels, practical steps, examples, and enough detail to make the post useful without requiring the viewer to search elsewhere.
A strong post doesn't merely display information. It gives the viewer a clear next action.
Transactional content still has a place, but constant selling can make the feed feel like a catalog. Balance promotional posts with education, demonstrations, opinions, and content that helps people make decisions.
Pair creative choices with a publishing system
Content design works better when you can review patterns over time. A simple calendar can separate educational carousels, community prompts, product posts, and relationship-focused Stories. For creators who need help organizing this process, a guide to posting cadence for creators can provide a starting point.
You can also use a practical guide to creating engaging content when developing hooks, captions, and post concepts. The tool matters less than the feedback loop: publish, measure the intended action, identify the design choice that influenced it, and create a stronger variation.
Why Instagram Engagement Matters for Growth
A follower count is like the size of a guest list. It shows how many accounts opted in, but not how many saw your post, remembered the idea, or passed it to someone else.
Engagement adds that missing layer. It shows whether content creates a response among the people who encounter it. Reach-based engagement is often the clearer efficiency signal because it compares actions with actual exposure, rather than treating every follower as equally likely to see a post.
Organic reach has become more competitive. As noted earlier, distribution alone cannot guarantee attention. A post that earns saves and shares may contribute more to growth than one that gathers visible likes but leads nowhere. Saves keep useful content available for later, while shares place it in front of new viewers, often through private messages or smaller conversations.
Treat engagement as a growth feedback signal
Strong interactions show which ideas deserve another version. Saves can point to evergreen education. Shares can reveal relatable or broadly useful topics. Messages can show where followers need personal guidance, product information, or reassurance.
Use this review checklist:
Track one primary rate: Keep the denominator consistent.
Compare formats fairly: Review Reels, carousels, images, and Stories in their own context.
Include private actions: Monitor saves, shares, and messages alongside likes.
Check reach efficiency: Ask how effectively reached viewers responded.
Repeat useful patterns: Turn strong topics and structures into fresh variations.
For a step-by-step audience plan, read this guide to growing an Instagram audience from zero to engaged followers.
If you want support with audience development, Gainsty offers an Instagram growth service covering audience targeting, analytics, account management, and engagement-focused activity. Review how those tools might fit alongside your own content measurement and community strategy.
.png&w=1920&q=75&dpl=dpl_34ZXCf12K5qjjdZjPn9snwDRADrB)




.png&w=750&q=75&dpl=dpl_34ZXCf12K5qjjdZjPn9snwDRADrB)