Why Most Creators Read Instagram Insights the Wrong Way
A small business owner might see a post with strong likes and assume the topic should be repeated. A creator might celebrate a Reel because its Views number is high, even though it reached relatively few unique accounts and generated almost no profile activity. Another account may publish consistently but compare isolated posts from different formats, audiences, and time periods as if they were equivalent.
That approach turns Instagram Insights into a scoreboard. The dashboard becomes a place to confirm which posts felt successful, rather than a system for testing what moves the account forward.
Instagram Insights is more useful when you treat it as a measurement system. Its core signals include likes, comments, shares, reach, impressions, profile activity, and audience characteristics. Academic guidance on social-media measurement identifies likes, comments, and shares as engagement metrics that help assess content effectiveness and audience interaction in practical social-media measurement guidance.
Practical rule: Never ask, “Which post got the most attention?” Ask, “Which post produced the outcome I need, and can I reproduce the conditions?”
The four jobs are straightforward:
Set up access correctly, so the account collects usable data.
Read each format on its own terms, because a Reel, Story, carousel, and Live session have different jobs.
Decode Views carefully, rather than treating every display as a new person.
Turn patterns into weekly actions, including what to scale, revise, or stop.
Likes can show approval, but they don't necessarily indicate usefulness or acquisition. Saves and shares often offer stronger evidence that a post helped someone enough to keep or pass it along. Reach shows distribution to unique accounts, while impressions can include repeat displays. Neither replaces the other, but neither should stand alone.
The practical outcome is a repeatable loop. Choose a consistent review period, compare formats fairly, identify the signal that matters for the objective, and attach one action to the result. That process is slower than checking follower count, but it produces decisions you can defend.
Setting Up Instagram Insights the Right Way
Instagram Insights requires a professional account, either Business or Creator. A personal profile won't provide the detailed measurement workspace needed for account and media analysis.
Open your profile, use the account settings to switch to a professional account, and choose the profile type that matches how you operate. A Business account generally fits a company, shop, or service provider that needs business contact features. A Creator account is usually more natural for an individual publishing under a personal brand. Both provide access to professional analytics, so the choice should reflect your public identity and workflow rather than an assumed reach advantage.
Once the switch is complete, open the Professional dashboard from your profile. The exact labels can change as Instagram updates its interface, but the useful areas remain familiar: account overview, content performance, audience information, and profile activity. If you're unsure which menu path your account currently uses, this guide to viewing Instagram analytics provides a visual reference.
Build a clean working routine
Don't begin by opening the top-performing post. Configure the workspace first.
Select a consistent date range. Use the available account and content filters, then keep the same period when comparing results. A fixed window prevents a recent post from being judged against an older post with more time to accumulate activity.
Review account and content views separately. Account-level data shows broader movement, while media-level data helps explain which individual assets created it.
Export what you can. Record each asset's format, publication time, reach, likes, comments, saves, shares, profile visits, and follows. Instagram supplies raw metrics, but analysts define formulas themselves, so consistent field names and calculations matter.
Connect Meta Business Suite when your workflow spans formats or team members. It can make review and reporting more manageable, but it doesn't remove the need to understand the underlying definitions.
A Business or Creator profile gives you access. It doesn't automatically give you a reliable system. The useful setup is the one that makes every review comparable, searchable, and connected to a decision.
Reading the Dashboards for Posts, Reels, Stories, and Live
The same metric can mean something different depending on the format. A like on a static image may indicate quick approval. A share on a Reel can suggest that the idea had enough relevance to pass to another person. A Story exit may reveal a weak transition rather than a weak topic.
Start with the format's job, then choose its headline metric.
Reels: Use Reach as the primary metric. Check shares, saves, profile visits, follows, likes, and comments as supporting signals. Rewrite the opening when distribution is broad but sharing and profile activity remain weak.
Carousels: Use Reach and interaction rate by reach as the primary metrics. Check saves, shares, comments, and slide progression where available as supporting signals. Reorder or shorten early slides when viewers do not reach the payoff.
Stories: Use completion and meaningful actions as the primary metrics. Check replies, sticker interactions, profile activity, exits, and forwards as supporting signals. Tighten the opening or remove unnecessary frames when viewers leave early.
Live: Use meaningful participation as the primary metric. Check comments, questions, profile visits, follows, and replay activity as supporting signals. Change the topic or promotion when attention does not translate into interaction.
Reels need more than a large view total
For Reels, separate distribution from response. Reach tells you how many unique accounts saw the content. Shares and saves show whether the idea had utility or social value, while profile visits and follows indicate whether the Reel created a next step.
A Reel with broad reach and weak interactions may have a strong visual hook but poor relevance after the opening. A Reel with modest reach and strong shares may contain a repeatable idea worth developing into a series. Likes are useful context, but they shouldn't outrank actions that indicate usefulness or movement through the profile.
Carousels expose sequencing problems
A carousel is not one image repeated across slides. The first frame earns the swipe, the middle frames sustain attention, and the final frame delivers the promised value or action. Compare reach and interactions with swipe behavior where Instagram provides it.
If people engage with the first frame but don't progress toward the explanation, the topic may be sound and the sequence may be wrong. Cut setup, move the clearest benefit earlier, and make each slide create a reason to continue.
Stories and Live require relationship signals
Stories are often better for existing followers than discovery. Replies, sticker interactions, profile activity, and exits help distinguish passive viewing from active interest. A high forward rate early in a sequence can indicate that the opening lacks context or asks viewers to wait too long.
Live content needs a different interpretation again. A session can have useful commercial or community value without producing the same interaction pattern as a Reel. Look at questions, comments, profile visits, follows, and replay activity, then assess whether the session advanced the intended relationship.
For teams that need an additional way to inspect creator performance across accounts, free Instagram influencer analytics can complement native Insights. Use third-party tooling as a reporting aid, not as a substitute for checking Instagram's own metric definitions.
What the New Views Metric Actually Tells You
Views is an exposure count, not automatically a people count. That distinction matters because repeat viewing can increase Views without expanding the unique audience.
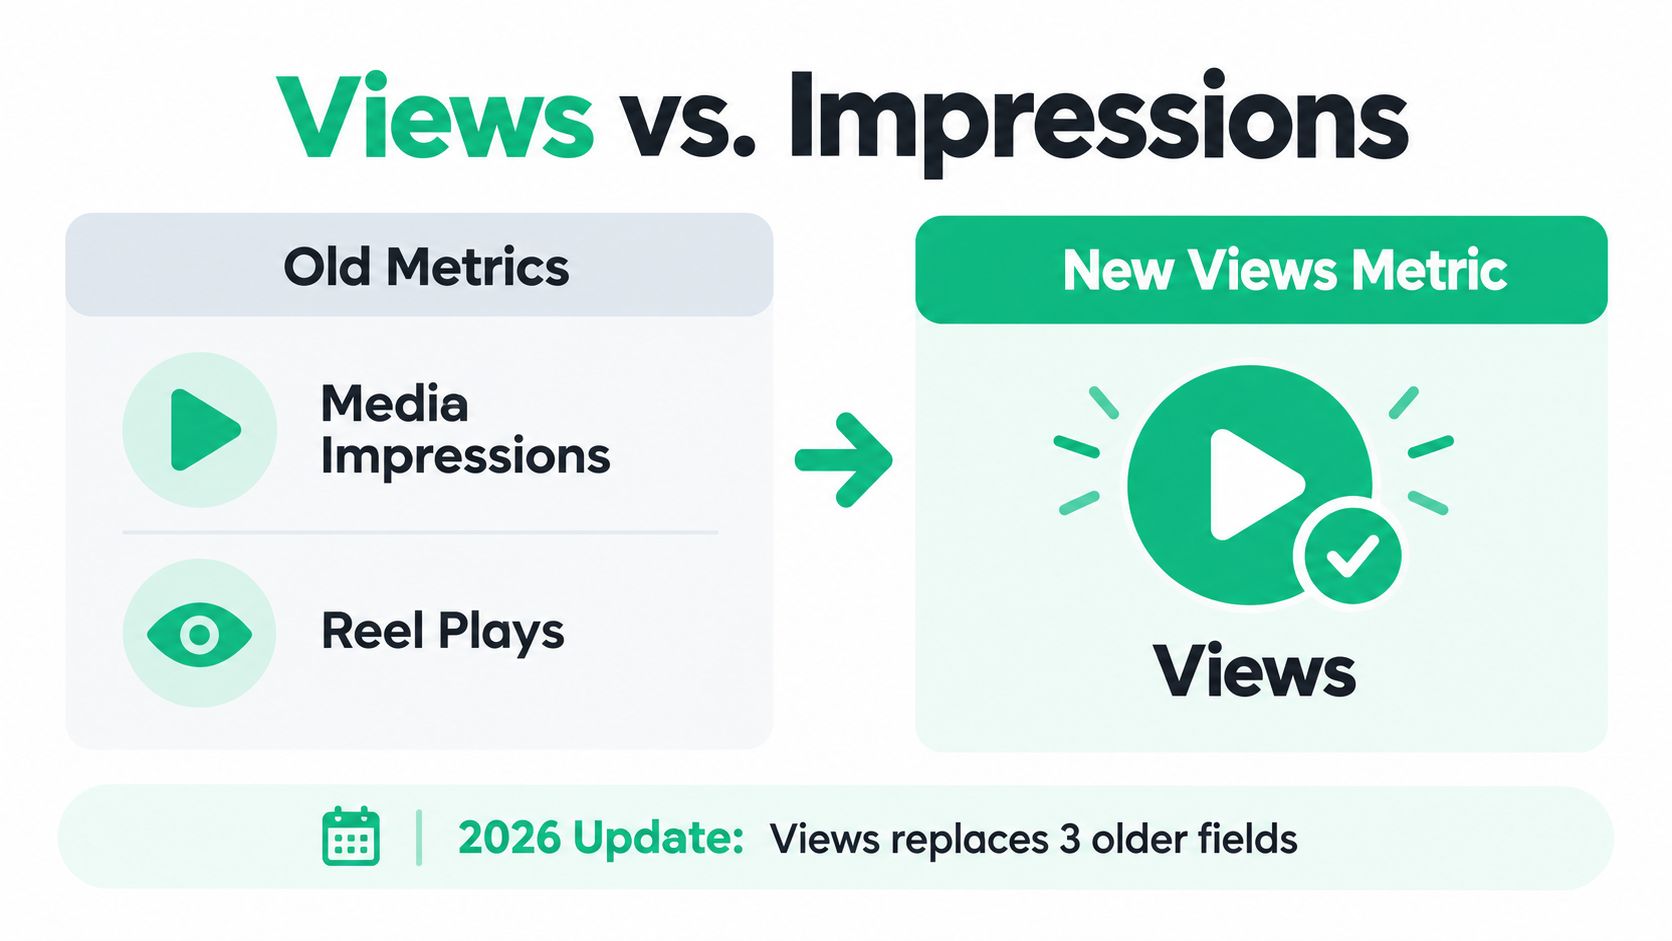
Meta's API documentation records metric deprecations beginning in 2025, while industry documentation explains that Views replaced older fields including media impressions and Reel plays. The change creates a reporting problem for anyone who compares historical exports without checking whether the underlying field still means the same thing. The Instagram impression and view comparison is useful background, but your dashboard still needs its own definitions.
Read Views beside Reach
Reach counts unique accounts exposed to content. Views may include repeated exposure, so a high number can indicate replay, looping, or multiple displays rather than broader discovery.
Use a small set of paired readings:
Views and Reach: Estimate whether exposure is expanding or repeating among the same audience.
Reach and Follows: See whether distribution creates account growth.
Profile activity and Reach: Identify whether people take the next step.
Shares and Views: Assess whether the content travels relative to its exposure.
Saves and Views: Check whether repeat attention reflects durable usefulness.
A Reel can therefore produce a large Views total while reaching a narrower group repeatedly. Another Reel can produce fewer Views but expose the account to more unique people and generate stronger follower acquisition. The second result may be more valuable for discovery, even though the first looks better in a basic screenshot.
The same logic applies when producing repeatable creative at scale. Teams exploring AI video production for fashion brands should evaluate whether additional viewing represents new audience exposure, repeated playback, or stronger downstream action. More output doesn't solve an unclear measurement model.
Don't celebrate Views until you know what Reach, shares, profile activity, and follows did beside it.
Historical comparisons deserve caution. If an older report used impressions or Reel plays and a newer report uses Views, label the change rather than presenting the series as continuous. Keep the raw field name, define the denominator, and use ratios that remain interpretable for the reporting period.
Mapping Your Audience and the Segments That Actually Convert
Audience data becomes useful only when you connect it to behavior. Location, age, gender where available, active times, and follower status are descriptive fields. They become strategic when you compare them with profile visits, website taps, direct messages, follows, saves, and shares.
Start with two audiences, not one: followers and reached non-followers. A post can serve both groups differently. Followers may already understand your offer and respond through Stories or direct messages, while non-followers may encounter the account through Reels and need a clearer profile path before they act.
Instagram's scale makes generic benchmarks especially weak. Published summaries place the platform at approximately 3 billion monthly active users in 2025, after 1 billion in 2018 and around 2 billion in 2021–2022, with roughly 30% of users in the 18–24 age range and the 25–34 group also among the largest cohorts, as summarized by Instagram's audience and platform statistics. Those figures explain why segmentation matters, but they shouldn't determine your content plan.
Build segments around outcomes
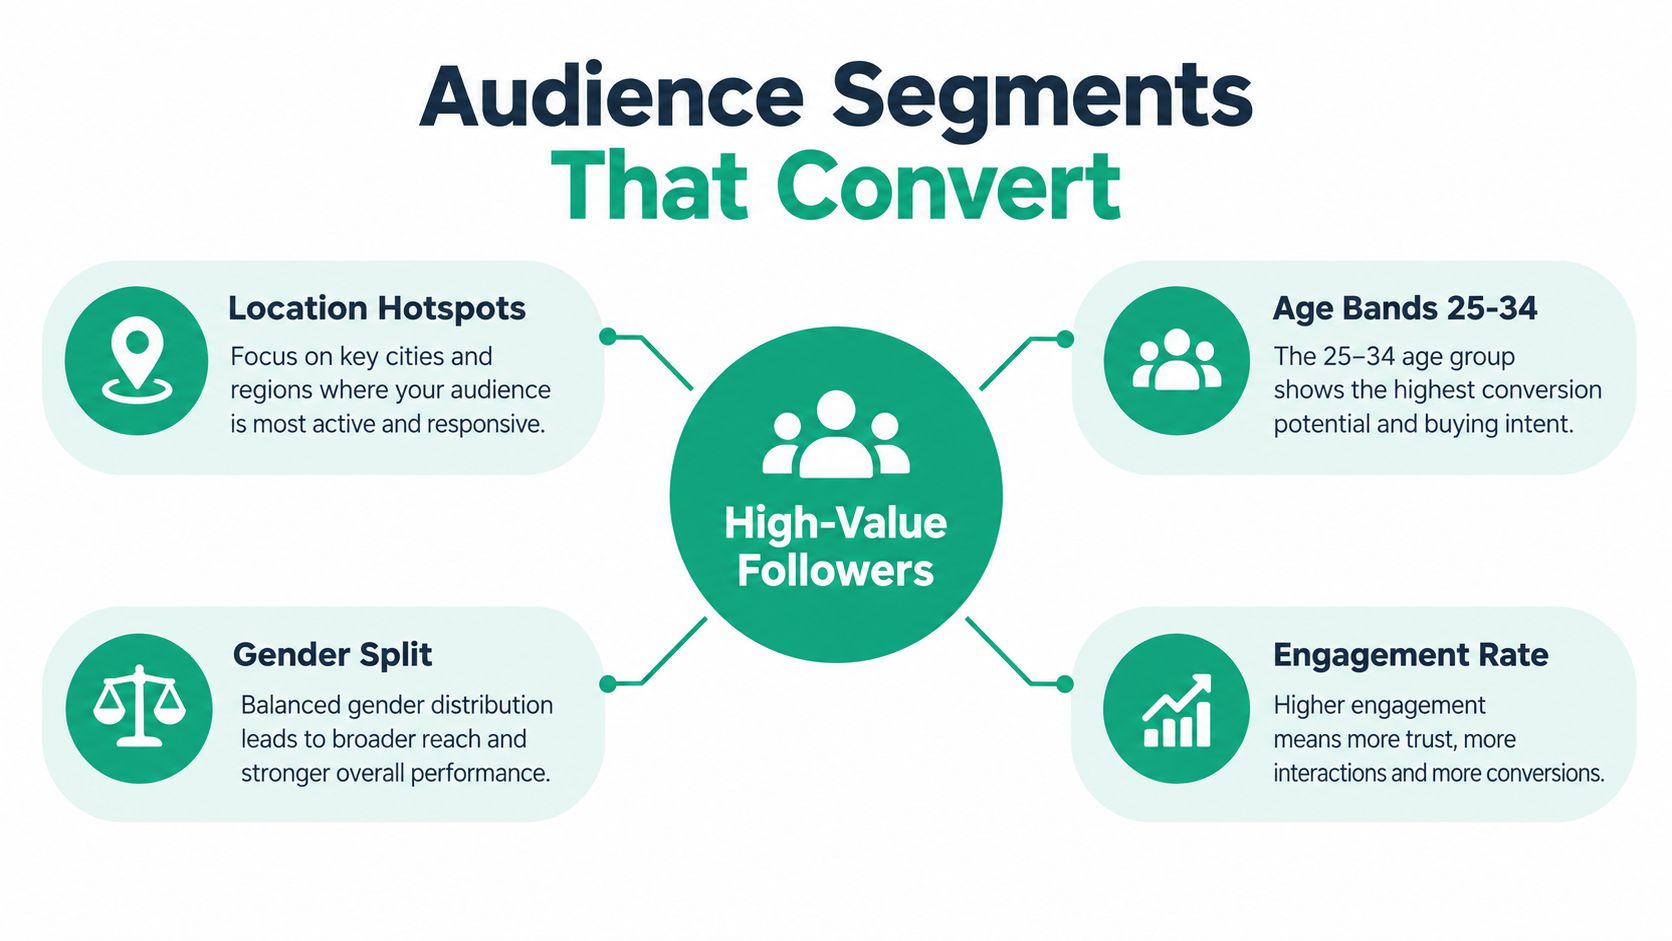
Use the audience tab as a starting point, then test each segment against a business result:
Location: Compare where followers and reached accounts live with the locations you can serve.
Age bands: Check whether the people responding match the buyer or community you want.
Gender distribution: Use the field where available, but avoid treating it as a reason to stereotype creative.
Active times: Compare follower activity with the publication times of posts that produced meaningful actions.
Follower status: Separate discovery content from content that converts an existing relationship.
A practical pattern is a Reel that earns most of its Reach from non-followers while Stories generate most website taps from followers. That doesn't mean the Reel failed to convert. It may be doing its correct job as a discovery engine, while Stories provide the context and call to action that existing followers trust.
Treat demographics as hypotheses
If the audience location doesn't match your service area, review topics, distribution, and profile language before increasing publication volume. If a large age band watches but doesn't visit the profile, the content may attract curiosity without making the offer clear.
For a deeper explanation of how to interpret age, location, and related audience fields, use this Instagram audience demographics guide. The important habit is to compare audience composition with outcomes, not to optimize for a demographic just because it is large.
Turning Numbers Into a 30-Day Growth Plan
A Reel can reach 20,000 accounts and produce fewer profile visits than a post reaching 6,000. A follower count snapshot will not explain that difference. Build the plan around the path from Reach to interactions, profile visits, and follows, then assign each result a decision.
Use the standard formula, (likes + comments + saves + shares) divided by reach, multiplied by 100, to normalize performance across different audience sizes. For example, 240 interactions from 6,000 reached accounts equals a 4% reach-based engagement rate. Keep the denominator consistent across the month, and separate Views from Reach where repeat exposure may inflate the first number.
Use a rolling review rhythm
Run the next 30 days as comparable tests:
Weekly snapshot: Record each post's format, topic, publication date, Reach, Views where available, interactions, profile visits, follows, saves, and shares.
Rolling cohort comparison: Compare one rolling 28-day cohort with the previous cohort. Work from media-level fields and define calculations consistently, as outlined in the Instagram media Insights documentation.
Median and mean: Review both. A viral post can lift the mean, while the median shows typical performance.
Decision log: Write one action beside each pattern, such as repeat, rework, reposition, or stop.
For a concrete example, suppose the previous 28 days produced 12 posts, a median Reach of 1,800, 90 profile visits, and 14 follows. In the current cohort, 14 posts produced a median Reach of 2,100, 130 profile visits, and 22 follows. Keep the format in rotation because both distribution and downstream action improved. If Reach rose while follows fell, change the profile promise or call to action before increasing output.
If Reach is strong but saves and shares stay weak, revise the hook or usefulness of the post. If profile visits rise without follows, fix positioning, proof, and the next step. Record the reason for every change, not just the result. That turns a dashboard into a 30-day growth plan.
A Repeatable Insights Workflow You Can Run Every Week
A useful workflow fits beside your publishing calendar.
Monday snapshot: Export account activity, reach, profile visits, follows, and audience changes from the previous period.
Midweek Reels review: Compare Views with Reach, shares, saves, profile visits, and follows. Flag repeat exposure that isn't creating audience expansion.
Friday Story review: Check replies, sticker actions, profile activity, exits, and forwards. Adjust sequence length and opening context.
Monthly cohort check: Compare the current rolling 28-day group with the prior group, using median and mean performance.
For every post, ask one question: What decision does this result support? The answer might be to repeat the topic, change the opening, move the call to action, shift the format, or stop spending production time on the idea.
Keep a simple export with format, date, topic, hook, caption, call to action, reach, views where available, interactions, profile visits, follows, saves, and shares. That record helps you spot repeated patterns instead of relying on memory.
Gainsty can be considered an organic growth tool that uses audience targeting and analytics alongside your existing Instagram workflow. It should support the signals your Insights already identifies, not replace the weekly review.
If you want help aligning organic audience targeting with the patterns in your Instagram data, visit Gainsty. Use the Insights workflow first, then evaluate whether its growth support fits the segments, formats, and outcomes you're already measuring.