Why Tracking Growth Is More Than a Vanity Metric
A higher follower count can feel validating, but the real value is diagnostic. Growth shows whether your content consistently attracts the right people and whether your profile turns interest into a follow.
On Instagram, that matters because discovery potential is still massive. As of April 2026, Instagram has approximately 3 billion monthly active users worldwide, with projected user growth of 3.55% for the year, and people aged 18 to 24 make up over 31% of the user base, according to Statista's Instagram data. Even small gains in discovery or profile conversion can compound over time.
Growth validates positioning
Follower growth is one of the clearest signals that your positioning is working. If a creator, local business, or brand keeps posting and stays flat, the issue usually is not just “the algorithm.” It is often one of three things:
Weak discovery: Content is not reaching enough non-followers.
Weak conversion: People visit the profile but do not follow.
Weak audience fit: The content attracts attention from people who were never likely to stay.
That is why brands trying to grow Instagram organically should not focus only on frequency or aesthetics. They need a system that ties growth back to audience behavior.
`Practical rule: If you cannot explain why followers increased last month, you cannot reliably repeat the result next month.
Growth has commercial meaning
Follower growth does not equal revenue, but it expands the group of people who see future posts, Stories, launches, and offers without paying for every impression. For brands, that reduces reliance on short-term spikes. For creators, it increases the base from which engagement, partnerships, and demand can grow.
The better question is not “Did followers go up?” It is “Which content brought in new people, and did they stay?”
The Essential Follower Growth Metrics You Must Track
A follower total alone is not enough. Track three metrics together: net follower growth, follower growth rate, and follower churn rate. Together they show the size of the gain, the pace relative to account size, and whether those new followers were a good fit.

Net follower growth
Net growth measures actual audience expansion over a set period.
Formula: New Followers - Unfollows
Use it to compare weeks, launches, collaborations, or content themes. Gross follows can make a campaign look stronger than it was. Net growth shows what remained.
Example: if an account gains 120 followers in a month and loses 45, net follower growth is 75.
That number still needs context. A gain of 75 from non-follower reach means something very different from a gain of 75 driven by a giveaway or paid mention.
Follower growth rate
Growth rate puts follower change in proportion to your starting size.
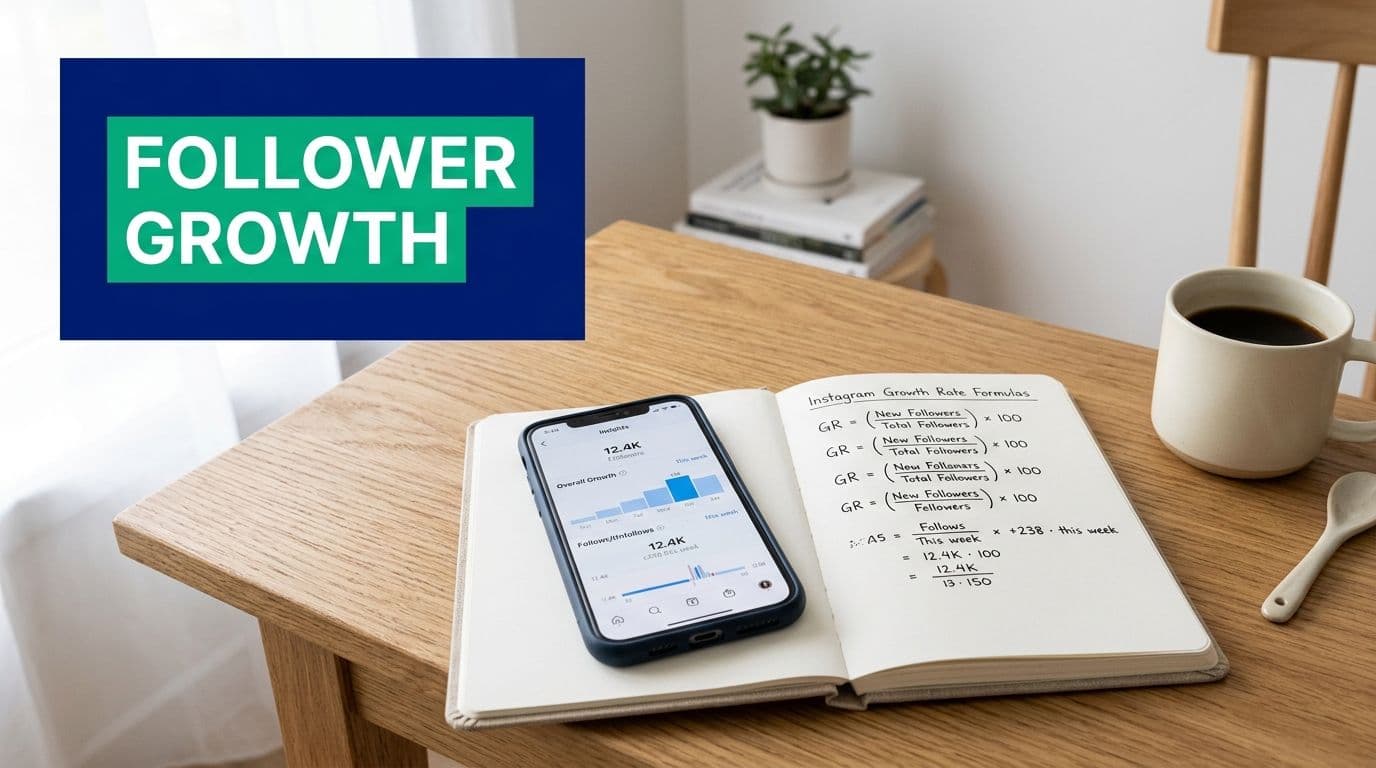
Formula: [(Followers_end - Followers_start) / Followers_start] × 100
This matters because account size changes the reading. Adding 100 followers to a 2,000-follower account is much stronger than adding 100 to a 200,000-follower account. Rate makes periods easier to compare.
Churn rate
Churn rate shows how much of your existing base you lost during the period.
Formula: (Unfollows / Starting Followers) × 100
This is the metric that exposes weak-fit growth. If follows are rising but churn is also high, the account may be attracting curiosity instead of the right audience. That often happens after giveaways, trend chasing outside the niche, or abrupt shifts in content.
Read the three metrics together
Each metric answers a different question:
Net follower growth: Did the audience expand? -
Follower growth rate: How fast did it expand relative to account size? -
Churn rate: How much leaked out during the same period?
The insight is in the combination. High net growth with low churn usually means discovery and conversion are aligned. High growth rate with high churn often means the content reached the wrong people or created the wrong expectation. Flat net growth with low churn can still be encouraging if profile visits and non-follower reach are improving.
This is also why follower growth should sit beside your broader set of Instagram performance metrics, especially reach, profile visits, and content-level non-follower exposure.
If brand partnerships matter, pair growth tracking with engagement quality. SponsorRadar insights for better brand deals is a useful reference for showing why audience quality matters as much as size.
Your Toolkit for Measuring Instagram Growth
You do not need an expensive stack. You need a simple system that preserves trend data and lets you compare follower movement with content performance.
A practical setup has three layers: Instagram Insights for native data, a spreadsheet for trend tracking, and a third-party dashboard if you need faster analysis.

Instagram Insights for first-party numbers
Instagram Insights is the best starting point. It shows follower changes, reach, content performance, and audience activity inside the platform. Its biggest strength is post-level visibility. You can inspect a Reel, carousel, or Story and see how it performed.
Its main weakness is memory. Once you want to compare this month’s follower movement with a content theme from weeks ago, native Insights gets clumsy.
Track these fields on a fixed schedule:
Starting followers: Record the count at the same time each week or month.
Ending followers: Capture the closing count for the period.
New follows and unfollows: Pull both when available, not just the net change.
Top content: Note which posts drove the strongest reach, profile visits, or follows.
Discovery indicators: Track whether the content reached non-followers.
A spreadsheet for trend memory
A simple Google Sheet fills the gap Instagram leaves. It creates a permanent log.
Use one row per week for tactical review and one row per month for strategic review. Weekly rows catch fast changes. Monthly rows show the broader trend.
A basic tracker should include:
Instagram Insights: Instagram’s built-in analytics tool is the best choice for reviewing individual post performance using first-party data. It provides metrics such as reach, impressions, engagement, follower growth, audience demographics, and content performance—all at no additional cost. It’s ideal for creators and businesses who want quick, reliable insights directly within Instagram.
Google Sheets: Google Sheets is useful for manually tracking trends over time. You can build custom dashboards, calculate growth rates, compare monthly performance, and record historical data in whatever format best suits your workflow. While it requires manual updates, it’s flexible, customizable, and completely free.
Third-party analytics platform: Dedicated analytics platforms offer more advanced reporting than native tools. They typically include automated dashboards, historical data, competitor analysis, scheduled reports, and easier identification of long-term performance patterns. These tools are best for teams, agencies, or businesses that need deeper insights, though pricing varies depending on the platform and feature set.
Your sheet does not need to be complex. Include starting followers, ending followers, net growth, growth rate, churn rate, top posts, and a short note about what changed that period. Those notes often reveal repeatable patterns.
Third-party tools for faster diagnosis
Once the account has enough activity that manual review gets messy, third-party tools save time. They are useful when you want trend lines, content comparisons, or a consolidated dashboard.
One option is a platform like Gainsty, which provides a live dashboard that includes follower gains. That setup is practical for teams that want a running view instead of manual snapshots.
If you are comparing software choices, this roundup of Instagram analytics tools is a practical place to start.
Video performance also deserves separate review, especially if Reels drive most discovery. For that side of the workflow, ProdShort's video analytics guide is useful for understanding how video-level reporting can support content decisions.
Working standard: If your system does not let you line up follower movement with specific posts, it is incomplete.
Setting Realistic Growth Benchmarks for Your Account
The fastest way to misread performance is to compare yourself to a vague average. “Good growth” depends heavily on account size.
According to Social Status benchmark data, the average monthly Instagram growth rate is 1.85%, while a growing brand with 1 to 190K followers may see around 1% growth, and a large brand with 1.1M+ followers may average 0.5%. Larger accounts usually grow more slowly on a percentage basis.
How to read your own rate
Small and mid-sized accounts can often grow faster because a strong post affects a larger share of the total base. Larger accounts usually expand more steadily, but more slowly by percentage.
Use these benchmark bands as interpretation tools, not promises:
Smaller growing accounts: Smaller accounts often experience faster percentage growth because each new follower represents a larger share of their audience. However, growth can also be more volatile, with noticeable spikes and dips from individual posts or campaigns.
Mid-sized accounts: For mid-sized accounts, growth tends to reflect consistent content and audience engagement rather than occasional viral posts. Steady publishing and ongoing relationship-building usually have a greater impact than one-off performance spikes.
Large accounts: Large accounts typically show lower percentage growth rates, but even a small percentage increase can translate into thousands of new followers. At this stage, maintaining audience quality and long-term engagement is often more important than chasing high percentage growth.
Benchmarks do not replace context
Niche still matters. A broad consumer niche may gain followers more easily than a narrow service business with a smaller addressable audience. That does not make one healthier than the other.
It is usually more useful to compare your current rate against your own recent pattern than against a random account with a different audience, content mix, and sales cycle.
Consider these questions when judging whether your growth is healthy:
Are spikes tied to repeatable content formats? If yes, growth is more dependable.
Is churn low enough that gains are sticking? If not, acquisition quality may be poor.
Do profile visits convert into follows at a stable pace? If not, the profile may need work.
Does your growth match your business model? A niche consultant and a broad lifestyle creator should not expect the same pace.
The right benchmark should reduce panic, not push you to copy accounts playing a different game.
How to Interpret Your Data and Refine Your Strategy
Measurement becomes useful when it leads to a decision. The key question is not “Did followers increase?” It is “Which content caused discovery, and what should I repeat or stop?”

When growth spikes
Start with the dates. Find the period where follower count rose faster than usual in your tracking sheet. Then check Instagram Insights for the posts published just before and during that window.
You are looking for content that did two things:
Reached people who were not already following you.
Created enough interest to drive profile visits and follows.
Generic reporting often stops too early. As Unscrambl notes in its analysis of Instagram metrics, many creators know the growth rate but do not connect the spike to the discovery metric behind it. If a Reel drew a high share of views from non-followers, that is often the trigger worth studying.
What to compare post by post
Do not compare everything. Compare the signals most likely to explain discovery and conversion.
Check each candidate post for:
Non-follower reach: Did the post break beyond your current audience?
Shares: Did people pass it along?
Skip behavior or weak retention signals: Did viewers leave quickly?
Profile activity after exposure: Did the post create enough curiosity to move people to your profile?
Dash Social has pointed out that recent platform guidance puts more weight on shares and skip rates, while comments are less important than many older guides suggest, in its piece on organic Instagram growth benchmarks. That changes how you should read engagement. A post with fewer comments but stronger shares may drive more follower growth than a post that gets conversation from existing followers but little new discovery.
What different patterns usually mean
Different metric combinations point to different problems.
High reach, low follower gain: Many people saw your content, but relatively few chose to follow your account. This usually means the content attracted attention without giving viewers a compelling reason to stay. Improve your profile by making your niche, value proposition, and content promise immediately clear so visitors understand why they should follow.
High new followers, high churn: You’re gaining followers, but they’re leaving at a similar rate. This often indicates that the people you’re attracting aren’t a good long-term fit for your content. Refine your messaging, narrow your content focus, and target a more specific audience whose expectations match what you consistently publish.
Moderate reach, strong follower gain: Even without massive reach, your content is converting viewers into followers effectively. This suggests you’re attracting the right audience with a clear message. Review the topic, hook, format, and call to action behind these posts, then create similar content to repeat that success.
Strong engagement from followers, weak discovery: Your existing audience enjoys your content, but Instagram isn’t showing it to many new people. This often means your content excels at nurturing your community but isn’t optimized for discovery. Introduce more discovery-focused formats—such as Reels, collaborations, trend-relevant content, or searchable educational posts—to reach people who don’t already follow you.
A workable refinement loop
Use a short operating rhythm instead of reacting to single posts.
First, flag the content that lines up with follower jumps. Second, inspect the discovery signals on those posts. Third, group the winners by topic, hook style, format, and intent. Then publish the next round with those traits repeated on purpose.
Do not scale a post because it “went viral.” Scale it because you can explain which audience behavior made it work.
This matters even more with Reels. Verified benchmark data shows that Reels account for 46% of all time spent on Instagram, are shared more than 4.5 billion times daily, and have an average engagement rate of about 2.8%, according to Social Status's Instagram benchmark research. That does not mean every account should publish only video. It does mean that if you want to expand beyond your current followers, Reels deserve close measurement because they remain one of the strongest discovery formats on the platform.
Conclusion: Creating a Sustainable Growth Rhythm
The accounts that improve fastest are usually not the ones posting the most. They are the ones measuring consistently enough to learn from each cycle.
If you want to measure Instagram follower growth well, keep the process simple. Record the core numbers weekly. Review the bigger pattern monthly. When you see a spike, trace it back to the post, check whether non-followers discovered you through it, and decide what to repeat.
That rhythm helps you avoid two traps: overreacting to daily fluctuations and missing the patterns that compound over time. Growth gets easier to manage when you stop treating every post as a separate event and start treating your account like a system.
A practical cadence looks like this:
Weekly check-ins: follower change, top posts, notable drops or spikes
Monthly review: growth rate, churn, strongest discovery drivers, repeated content themes
Strategy adjustment: keep what attracts qualified followers, cut what creates noise or weak-fit growth
Done this way, measurement is not admin work. It is feedback. And when you use that feedback consistently, your content gets sharper, your audience fit improves, and follower growth becomes more predictable.
If you want a simpler way to monitor follower gains and keep your Instagram reporting in one place, Gainsty offers tools that support ongoing growth tracking without relying on bots or fake followers.

.png&w=1920&q=75&dpl=dpl_C723nkStk4By7P6JWE3DQWUAB8y4)







.png&w=750&q=75&dpl=dpl_C723nkStk4By7P6JWE3DQWUAB8y4)